Category: ETP Field Guide

  • ইটিপি ও ডব্লিউটিপি O&M ড্যাশবোর্ড ও স্ট্যান্ডার্ড রিভিউ

    Read in English

    সাপ্তাহিক O&M রিভিউতে রিডিং, সিদ্ধান্ত ও ফলোআপের যোগসূত্র দেখা দরকার। এ দৃষ্টিতে আগের পাঁচটি এক্সেল নমুনা পর্যালোচনা করেছি। নতুন ওয়ার্কবুকে তাদের নমুনা রেকর্ড একসঙ্গে এনে কোথায় আরও প্রমাণ দরকার, তা দেখানো হয়েছে।

    ড্যাশবোর্ড ওয়ার্কবুক ডাউনলোড করুন

    ইটিপি ও ডব্লিউটিপি O&M ড্যাশবোর্ড (.xlsx)। Review Setup শিটে পারফরম্যান্স ও খরচের জন্য সপ্তাহ বেছে নিন। নির্ধারিত স্যাম্পল ও অ্যাকশন দেখার জন্য রিভিউ তারিখ দিন। লগের হালকা হলুদ সেলগুলোতে ইনপুট দিন। রিডিং, শিডিউল, রিস্ক স্কোর ও খরচের তথ্য অনুশীলনের জন্য কাল্পনিক। শিট ও কলামের নাম ইংরেজিতে।
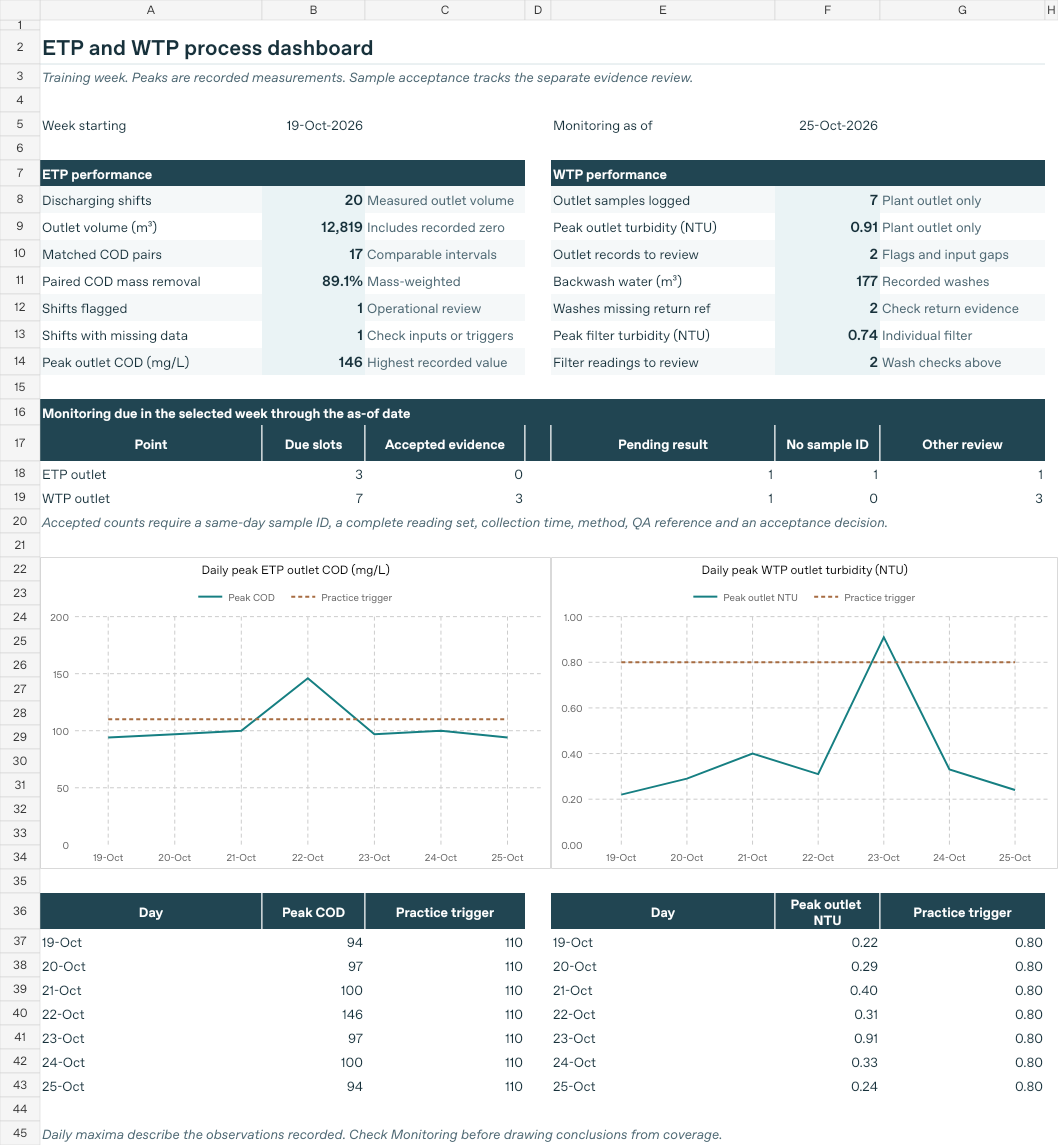
    এক্সেল প্রসেস ড্যাশবোর্ডে ইটিপি ও ডব্লিউটিপির সর্বোচ্চ রিডিং, ব্যাকওয়াশ চেক ও স্যাম্পলের প্রমাণ
    নমুনা সপ্তাহের প্রসেস ড্যাশবোর্ড। সর্বোচ্চ রিডিংয়ের পাশাপাশি স্যাম্পলের প্রমাণ যাচাই করুন।

    তিনটি ড্যাশবোর্ডে যা দেখা যাবে

    • প্রসেস পারফরম্যান্স। ডিসচার্জ হয়েছে এমন ২০টি শিফটের মধ্যে তুলনাযোগ্য ১৭টি ইনলেট–আউটলেট জোড়ায় COD মাস রিমুভাল ৮৯.১%। ফলের সঙ্গে ডেটার কভারেজও দেখুন। ডব্লিউটিপিতে ১৭৭ m³ ব্যাকওয়াশ পানি রেকর্ড হয়েছে। দুটি ব্যাকওয়াশের পর ফিল্টার চালুর চেকের রেফারেন্স বাকি।
    • অ্যাসেট রিলায়েবিলিটি ও অ্যাকশন। নমুনায় likelihood ও consequence দিয়ে PM-এর অগ্রাধিকার দেখানো হয়েছে। উচ্চ রিস্কের দুটি অ্যাসেটের PM ওভারডিউ। কাজের তারিখ, ভেরিফিকেশনের তারিখ, যাচাইকারী ও রেফারেন্স দিলে যাচাই করা ক্লোজআউট দেখা যায়।
    • অপারেটিং খরচ ও ডোজিং। নমুনা সপ্তাহে এনার্জি ০.৬৯ kWh/m³ এবং রেকর্ড করা এনার্জি ও কেমিক্যালের খরচ ১৪.৭৪ BDT/m³। প্রতিটি রেটের জন্য একই সময়কালের মিল থাকা রেকর্ড নেওয়া হয়েছে। একটি রেকর্ডে কেমিক্যালের পরিমাণ বাকি থাকায় সেটি খরচের হিসাব থেকে বাদ গেছে। পাম্পের হিসাব করা ফিড ৩০.০০ L/h, মাপা ডেলিভারি ২৯.৪০ L/h।

    আগের পাঁচটি নমুনায় কী ঘাটতি ছিল

    ওয়ার্কবুকযা ছিলপ্রমাণের ঘাটতিনতুন ওয়ার্কবুকে যা যোগ হয়েছে
    ইটিপি শিফট লগশিফট ভলিউম, জোড়া COD লোড ও রিভিউ ফ্ল্যাগঅনুমোদিত স্যাম্পলিং শিডিউল, সংগ্রহ, মেথড ও QA রেফারেন্সস্যাম্পল আইডির সঙ্গে শিডিউল ও রেজাল্ট মিলিয়ে দেখা
    ডব্লিউটিপি ফিল্টার ও আউটলেট লগফিল্টার রিডিং, ব্যাকওয়াশ ও প্লান্ট আউটলেটের পৃথক রেকর্ডফিল্টার পুনরায় চালুর চেক ও শিডিউল অনুযায়ী স্যাম্পল রিভিউব্যাকওয়াশের পর চেকের রেফারেন্স ও নির্ধারিত স্যাম্পলের হিসাব
    প্লান্ট PM ও ওয়ার্ক অর্ডারঅ্যাসেট আইডি, PM ইন্টারভ্যাল, দায়িত্ব ও ভেরিফিকেশন রেফারেন্সকন্ডিশন, ব্যাকআপ, রিস্ক স্কোরের ভিত্তি, রিনিউয়াল রিভিউ ও তারিখসহ যাচাইLikelihood × consequence র‍্যাঙ্কিং, ওভারডিউ PM ও ভেরিফাই করা ক্লোজআউট
    কেমিক্যাল ডোজিং ও অপারেটিং খরচএকটি শিফট ও নির্দিষ্ট সময়ের পাম্প ডেলিভারি টেস্টতুলনাযোগ্য সময়কাল, এনার্জি বেসলাইন ও টেস্টের ট্রেসেবিলিটিমিল থাকা রেকর্ডে সাপ্তাহিক খরচ, এনার্জি রেট ও টেস্টের রেফারেন্স
    ইটিপি/ডব্লিউটিপি O&M চেকলিস্টচেকের ফল, প্রমাণ, দায়িত্ব ও ফলোআপের সময়শিফট বদলের পরও ইস্যু ট্র্যাক ও ক্লোজআউট যাচাইঅ্যাকশন আইডি, সোর্স রেফারেন্স, নির্ধারিত তারিখ ও তারিখসহ সাইন-অফ

    প্রথমে Monitoring শিট দেখুন। নমুনার ১০টি নির্ধারিত স্যাম্পলের ৩টির গ্রহণযোগ্যতার প্রমাণ পূর্ণ। ২টির রেজাল্ট আসতে বাকি, ১টির স্যাম্পল আইডি নাই এবং বাকি ৪টির প্রমাণ রিভিউ করতে হবে। কোনো রিডিং দেখে অপারেটিং চেক শুরু করা যায়, একই সময়ে ওই স্যাম্পলের QA রিভিউ খোলা থাকতে পারে।

    কাজে লাগবে যে স্ট্যান্ডার্ড ও গাইড

    • বাংলাদেশের বিধিমালা। ডিসচার্জ ও রিপোর্টিংয়ের শর্ত ঠিক করতে প্রযোজ্য পরিবেশ অধিদপ্তরের বিধিমালা এবং প্লান্টের ছাড়পত্রের শর্ত দেখুন। ওয়ার্কবুকের ট্রিগারগুলো অনুশীলনের জন্য। পরিবেশ সংরক্ষণ বিধিমালা, ২০২৩।
    • অ্যাসেট ম্যানেজমেন্ট ও পারফরম্যান্স। ম্যানেজমেন্ট সিস্টেমের জন্য ISO 55001, অ্যাসেট প্ল্যানের জন্য EPA গাইড এবং পারফরম্যান্স মেজার বাছতে EUM Primer দেখুন। ISO 24511 ও ISO 24512 ইউটিলিটির সার্ভিস অ্যাসেসমেন্টে কাজে লাগে। ISO 55001:2024 · EPA অ্যাসেট গাইড · EPA EUM Primer · ISO 24511:2024 · ISO 24512:2024।
    • স্যাম্পলিং ও পানির নিরাপত্তা। ওয়েস্টওয়াটারের স্যাম্পলিং প্ল্যান ও স্যাম্পল হ্যান্ডলিংয়ের পদ্ধতি রেকর্ডের সঙ্গে রাখুন। পানীয় পানির প্লান্টের জন্য WHO গাইডে অপারেশনাল ও কমপ্লায়েন্স মনিটরিংয়ের আলাদা টেমপ্লেট আছে। ফিল্টার ও ব্যাকওয়াশ রিভিউয়ের জন্য EPA টার্বিডিটি গাইড দেখুন। ISO 5667-10 · ISO 5667-3 · WHO Water Safety Plan Manual · EPA টার্বিডিটি গাইড।
    • এনার্জি পারফরম্যান্স। kWh/m³ দিয়ে উন্নতি যাচাইয়ের আগে হিসাবের বাউন্ডারি ও তুলনাযোগ্য এনার্জি বেসলাইন ঠিক করুন। ফ্লো, লোড ও অপারেটিং ডিউটি বদলালে তুলনাও বদলায়। ISO 50006:2023।

    বাস্তব প্লান্টে অনুমোদিত মনিটরিং প্ল্যান দিয়ে শুরু করুন। কারা প্রমাণ গ্রহণ ও ক্লোজআউট যাচাই করবেন, তা নির্ধারণ করুন। পূর্ণাঙ্গ স্ট্যান্ডার্ড অ্যাসেসমেন্টের জন্য প্রযোজ্য সম্পূর্ণ ডকুমেন্ট, প্লান্টের পদ্ধতি ও বাস্তবায়নের রেকর্ড লাগবে। মাঠের তথ্য ধরতে শিফট ও রিভিউ চেকলিস্ট ব্যবহার করুন।
  • ETP and WTP O&M Dashboards and Standards Review

    বাংলায় পড়ুন

    A weekly O&M review should connect the reading, the decision, and the follow-up. I reviewed the five Excel starter files with that in mind. The new workbook brings their sample records together and shows where the team still needs evidence.

    Download the dashboard workbook

    Download the ETP/WTP O&M dashboard workbook (.xlsx). Start on Review Setup. Set the week for performance and cost, and the as-of date for due samples and actions. Edit the amber cells in the logs. The example readings and added plan, risk and cost records are fictional.

    Excel process dashboard with ETP and WTP peak trends, backwash checks and due sample evidence
    Process dashboard for the fictional training week. Daily peaks and evidence coverage answer different questions.

    What the three dashboards show

    • Process performance. The sample shows 89.1% COD mass removal from 17 comparable inlet/outlet pairs across 20 discharging shifts. Check the coverage alongside the result. The WTP logged 177 m³ of wash water and two washes still need a return-to-service reference.
    • Asset reliability and actions. The sample ranks PM work by likelihood and consequence and shows two high-risk assets with overdue PM. An action moves to verified closed when the work date, verification date, reviewer and reference support that status.
    • Resource cost and dosing. The training week shows 0.69 kWh/m³ and BDT 14.74/m³ for recorded energy and chemical costs. Each ratio uses its own matched intervals. One interval lacks a chemical quantity and drops out of the cost calculation. The pump example compares 30.00 L/h calculated with 29.40 L/h measured.

    Where the five starter files fall short

    WorkbookAlready coveredEvidence gapAdded in the dashboard workbook
    ETP Shift and Performance LogShift volumes, COD pairing, review flagsApproved sampling schedule, method, collection and QA evidencePlanned events matched to sample IDs and logged results
    WTP Filter and Water Quality LogSeparate filter readings, washes and outlet samplesEvidence of return-to-service checks and scheduled sample reviewBackwash return references and due versus accepted samples
    Plant PM and Work OrdersAsset IDs, PM intervals, owners and verification referencesCondition, backup, risk rationale, renewal review and dated verificationLikelihood × consequence ranking, PM exposure and verified closure
    Chemical Dosing and Operating CostOne shift and a timed pump checkComparable periods, energy baseline and pump test traceabilityMatched weekly cost and energy rates plus test evidence fields
    ETP/WTP O&M ChecklistsCheck result, evidence, owner and follow-up timeA shared register to follow issues across shifts and verify closureAction IDs, source references, due dates and dated sign-off

    Try the monitoring view first. In the sample, 3 of 10 due slots have complete acceptance evidence, 2 have a result pending and 1 lacks a sample ID. The remaining 4 need evidence review. A recorded peak can prompt an operating check while the sample’s evidence review is still open.

    Standards and guides to keep handy

    • Bangladesh regulatory basis. Use the applicable DoE rules and plant clearance conditions when setting discharge obligations and reporting requirements. The workbook uses practice triggers. Environment Conservation Rules, 2023.
    • Asset management and performance. Use ISO 55001 for the management system, EPA’s guide for building the asset plan, and the EUM Primer for selecting performance measures. ISO 24511 and ISO 24512 provide utility-level service assessment guidance. ISO 55001:2024 · EPA asset management guide · EPA EUM Primer · ISO 24511:2024 · ISO 24512:2024.
    • Sampling and water safety. Keep the wastewater sampling plan and sample handling procedure with the record. For drinking-water plants, WHO’s water safety plan has separate templates for operational and compliance monitoring. The EPA turbidity guide is a technical reference for filter-level monitoring and backwash review. ISO 5667-10 · ISO 5667-3 · WHO Water Safety Plan Manual · EPA turbidity guide.
    • Energy performance. Define the boundary and choose a comparable energy baseline before using kWh/m³ to judge improvement. Flow, load and operating duty can change the comparison. ISO 50006:2023.

    For a live plant, start with the approved monitoring plan and name the people who can accept evidence and verify closure. A full standards assessment also needs the complete applicable documents, site procedures and implementation records. Use the shift and review checklists to capture the field evidence.

  • Excel Skills for ETP and WTP Operations and Maintenance

    বাংলায় পড়ুন

    At shift handover, the next operator needs three answers. What changed, which reading needs a closer look, and who owns the next action? A well-built Excel log brings those answers together for an effluent treatment plant (ETP) or a water treatment plant (WTP).

    See the companion O&M dashboards and standards review for a combined weekly view and the evidence gaps in these templates.

    Download the sample workbooks

    Pair the workbooks with the O&M checklists for plant rounds, maintenance, and report review.

    Each workbook includes fictional data. Edit the amber cells and keep the blue calculation cells. Replace the practice triggers with values approved for your plant. The workbook labels are in English.

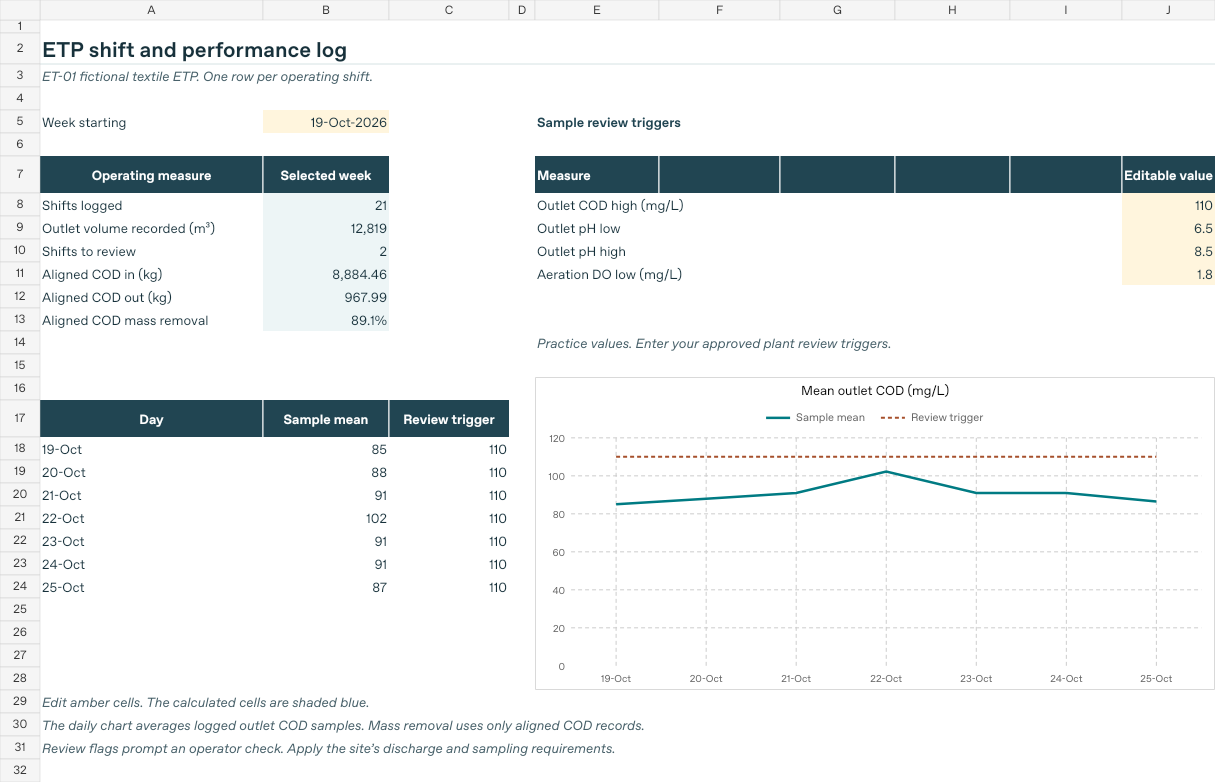
    Excel ETP overview with weekly shift totals and an outlet COD trend against a sample review trigger
    ETP sample overview. The COD trend helps you pick which shifts to review.

    Checklists for plant O&M

    Download the fillable O&M checklists (.xlsx). Save a copy for each shift, round, maintenance job, or report review. Record the evidence, assign an owner and follow-up time for each issue, and use your plant’s approved procedures and review triggers.

    ETP shift rounds and handover
    • Read the last handover. Confirm active trains, inlet and outlet volumes, equalization level, and any held flows.
    • Check the equipment, aeration DO, and solids separation from designated observation points. Log each sample by point, time, and ID.
    • Carry forward alarms, pending results, and unresolved issues with an owner and a check-back time.
    WTP rounds and water quality
    • Record active trains, feed and product flow, and filter status. Track headloss and turbidity by filter ID.
    • Log backwash events and return-to-service checks. Keep individual filter results separate from plant outlet samples.
    • Record missing tests and readings outside your plant’s triggers. Follow the escalation procedure.
    Maintenance planning and closeout
    • Match the job to the asset tag, due date, and assigned person. Confirm applicable permits and isolation with authorized staff.
    • Record the work, post-work test result, and verification reference. Confirm return-to-service authorization where required.
    • Update the asset history and next preventive maintenance date after verified closeout.
    Excel log and weekly report review
    • Check dates, units, sample IDs, duplicates, and gaps. Keep a pending result blank and add a note.
    • Check that formulas cover new rows. Reconcile volume totals and use matched intervals for COD mass removal.
    • Verify dosing and cost use the right chemical and volume bases. Review flagged readings before sharing summary averages.

    Build a log your next shift can use

    • Give each row one job. Use one row per ETP shift, one per WTP filter observation or backwash, and one per outlet sample. Keep the date, time or shift, sampling point, and record ID where applicable. Put units in the column headers.
    • Turn the log into an Excel Table. Use Insert → Table, freeze the header, and add drop-downs for shifts and equipment status. Filter by day, asset, or review flag during handover. Use conditional formatting to make review flags easy to spot.
    • Keep a missing result blank. Put ‘Lab result pending’ in the notes and follow it up by sample ID. A recorded zero, such as zero outlet volume on a held shift, carries a different meaning. Use COUNT and IF to check inputs before calculating.

    Turn readings into a decision

    Compare COD load as well as concentration. An ETP shift with 600 m³ at 700 mg/L receives 420 kg COD. Another with 760 m³ at 900 mg/L receives 684 kg, about 63% more. For shift volume in C9 and inlet COD in E9, try =IF(COUNT(C9,E9)=2,C9*E9/1000,""). Use a representative concentration for that volume. Calculate mass removal only when the inlet and outlet data represent comparable intervals.

    Review the trend and the underlying rows. Use SUMIFS to total volume or load over a date range and COUNTIFS to count review flags. Chart outlet COD or turbidity over time. A daily mean can hide a high individual reading, so keep the sample log one click away. Try a PivotTable to compare backwash volume by filter or open work orders by owner.

    Give each flag an owner and a next step. If a filter’s headloss and turbidity rise together, check the individual filter log and the plant’s procedure. Record the observation, action, and follow-up. For maintenance, close the loop with a date and verification reference.

    Try it with one shift

    Open the ETP sample and change the first inlet volume from 600 to 650 m³. The calculated load should move from 420 to 455 kg. Then clear the outlet COD result. The row should flag the missing data, and its paired load should drop out of the weekly mass balance. Save a fresh copy for your own plant.

    See the field note on COD load and equalization.

    Further reading Excel Tables · SUMIFS · PivotTables · EPA turbidity guidance · EPA asset management guide.

  • ১.৪.৩ মেমব্রেন প্রেশার ও পারমিয়েটের মান

    Read in English

    মেমব্রেন বায়োরিঅ্যাক্টরে (MBR) মিক্সড লিকার থেকে মেমব্রেন সলিডস আলাদা করে। মেমব্রেন পেরিয়ে আসা পানি পারমিয়েট। ট্রান্সমেমব্রেন প্রেশার (TMP) হলো ফিলট্রেশনের জন্য মেমব্রেনের দুই পাশের প্রেশারের পার্থক্য। এর সঙ্গে প্রতি একক মেমব্রেন এরিয়ায় পানি যাওয়ার রেট, অর্থাৎ ফ্লাক্স, দেখুন।

    ১০ সেকেন্ডের অ্যানিমেশন। মেমব্রেন পেরিয়ে পারমিয়েটের পথ দেখুন, তারপর তুলনীয় ফ্লাক্সে TMP তুলনা করুন।

    তুলনীয় অবস্থায় রিডিং দেখুন

    ET-01-এর পৃথক MBR উদাহরণে তুলনীয় ফ্লাক্সে TMP ১৬ থেকে ২৮ kPa হয়েছে। তাপমাত্রা, ফিলট্রেশন সাইকেলের ধাপ, সেন্সর রিডিং এবং পাওয়া গেলে প্রস্তুতকারকের নরমালাইজড ট্রেন্ড যাচাই করুন। তুলনীয় অবস্থায় TMP বৃদ্ধি ফিলট্রেশন রেজিস্ট্যান্স বাড়ার ইঙ্গিত দিতে পারে। ব্যবস্থা ঠিক করার আগে এয়ার স্কাওয়ার, ফিড পরিবর্তন ও ক্লিনিং হিস্ট্রি দেখুন।

    পারমিয়েটের পথ অনুসরণ করুন

    পারমিয়েটের স্বচ্ছতা বা টার্বিডিটি হঠাৎ বদলালে প্রথমে ইনস্ট্রুমেন্ট ও স্যাম্পল পয়েন্ট মিলিয়ে নিন। পরে সাইট ও প্রস্তুতকারকের প্রসিডিউর অনুযায়ী মেমব্রেন ইন্টেগ্রিটি, সিল এবং পারমিয়েট লাইনে বাইরে থেকে কিছু ঢোকার সম্ভাবনা যাচাই করুন। TMP, ফ্লাক্স, তাপমাত্রা ও পারমিয়েটের মান সময় এবং অপারেটিং স্ট্যাটাসসহ ট্রেন্ডে রাখুন। এতে ফিলট্রেশনের চাপ ও পানির মানের পরিবর্তন আলাদাভাবে বোঝা যায়।

    আরও পড়ুন · ইউএস EPA মেমব্রেন বায়োরিঅ্যাক্টর ফ্যাক্ট শিট

    ‹ আগের লেসন · অধ্যায়ের সূচি

  • 1.4.3 Membrane Pressure and Permeate Quality

    বাংলায় পড়ুন

    In a membrane bioreactor (MBR), membranes separate mixed liquor solids from the treated water, called permeate. Transmembrane pressure (TMP) is the pressure difference that drives filtration. Read it alongside the rate of water passing through each unit of membrane area, or flux.

    10-second illustration. Follow permeate across the membrane, then compare TMP at comparable flux.

    Compare like with like

    ET-01’s separate MBR example shows TMP rising from 16 to 28 kPa at comparable flux. Check temperature, filtration cycle stage, sensor readings, and the manufacturer’s normalized trend if available. A pressure rise under comparable conditions can signal increasing filtration resistance. Look at air scour, feed changes, and cleaning history before choosing a response.

    Follow the permeate

    A sudden change in permeate clarity or turbidity calls for its own checks. Confirm the instrument and sample point. Then review membrane integrity, seals, and possible ingress along the permeate route using the site and manufacturer procedures. Keep a trend that links TMP, flux, temperature, and permeate quality to time and operating state. A good trend helps separate the question of how hard the membrane is working from the question of what is passing through it.

    Further reading · U.S. EPA membrane bioreactor fact sheet

    ‹ Previous lesson · Chapter contents

  • ১.৪.২ COD, কালার ও জার টেস্ট

    Read in English

    বেশি COD ও আউটলেটের গাঢ় কালার ভিন্ন সমস্যার ইঙ্গিত দিতে পারে। ডোজ বদলানোর আগে পরিবর্তনের উৎস আপস্ট্রিমে খুঁজুন এবং একই ভিত্তিতে করা টেস্টগুলো তুলনা করুন।

    ১০ সেকেন্ডের অ্যানিমেশন। সেটলিংয়ের সময় আনট্রিটেড কন্ট্রোল ও উদাহরণের দুটি ট্রায়াল তুলনা করুন।

    COD কী কারণে বেড়েছে দেখুন

    ET-01-এ আউটলেট টোটাল COD ৮৪ থেকে ১৫৫ mg/L এবং টোটাল সাসপেন্ডেড সলিডস (TSS) ২৪ থেকে ৭৮ mg/L হয়েছে। ফিল্টারড COD ৬০ থেকে ৬৩ mg/L। এই পরিবর্তন টোটাল COD বৃদ্ধিতে সলিডস ক্যারিওভারের ভূমিকা সমর্থন করে। স্যাম্পল তুলনীয় কি না যাচাই করে সেটলিং ও সলিডসের পথ দেখুন।

    জার টেস্টে কালার ট্রিটমেন্ট তুলনা করুন

    কালার বদলালে প্রোডাকশন ব্যাচ, EQ-তে পৌঁছানোর সময়, pH, মিক্সিং ও বাস্তব কেমিক্যাল ডেলিভারি দেখুন। তত্ত্বাবধানে জার টেস্টে প্রতিনিধিত্বশীল স্যাম্পলের আনট্রিটেড কন্ট্রোল ও অনুমোদিত ট্রায়ালগুলো একই অবস্থায় তুলনা করা হয়। পদ্ধতি, pH, অবশিষ্ট কালার, সেটলিং ও উৎপন্ন স্লাজ লিখুন। সবচেয়ে স্বচ্ছ দেখানো জার একটি পর্যবেক্ষণ। সিদ্ধান্তে মাপা পানির মান, স্লাজ হ্যান্ডলিং ও অনুমোদিত সাইট প্রসিডিউর বিবেচনা করুন। অ্যানিমেশনে সেটলিংয়ের পর জারগুলোর তুলনা দেখানো হয়েছে।

    আরও পড়ুন · IFC টেক্সটাইল ওয়েস্টওয়াটার গাইডলাইন

    ‹ আগের লেসন · অধ্যায়ের সূচি · পরের লেসন ›

  • 1.4.2 COD, Color, and Jar Testing

    বাংলায় পড়ুন

    A high COD result and a darker outlet can point to different treatment problems. Trace the change upstream and compare tests made on the same basis before adjusting a dose.

    10-second illustration. Compare the untreated control and two illustrative trials as they settle.

    Find what is driving the COD result

    At ET-01, total outlet COD increases from 84 to 155 mg/L and total suspended solids (TSS) rise from 24 to 78 mg/L. Filtered COD changes from 60 to 63 mg/L. That pattern supports solids carryover as an important contributor to the total COD rise. Verify sample comparability, then check settling and the solids path.

    Use a jar test to compare color treatment

    For a color shift, check the production batch, EQ timing, pH, mixing, and actual chemical delivery. A supervised jar test compares a representative sample with an untreated control and approved trials under matched conditions. Record the method, pH, residual color, settling behavior, and sludge produced. The clearest-looking jar is one observation. A decision also uses measured quality, sludge handling, and the site’s approved operating procedure. The animation shows an illustrative comparison of jars after settling.

    Further reading · IFC textile wastewater guidance

    ‹ Previous lesson · Chapter contents · Next lesson ›

  • ১.৩.২ এফ্লুয়েন্ট স্যাম্পলিং

    Read in English

    ল্যাব ফল কাজে লাগে যখন জানা যায় কোন পয়েন্টে, কখন এবং কোন পদ্ধতিতে পানি নেওয়া হয়েছিল। স্যাম্পল পয়েন্ট ছাড়ার আগেই স্যাম্পলের আইডি দিন।

    ১০ সেকেন্ডের অ্যানিমেশন। সংগ্রহের পয়েন্ট থেকে মিলযুক্ত ল্যাব রিপোর্ট পর্যন্ত O-16 স্যাম্পলের পথ দেখুন।

    সিদ্ধান্ত অনুযায়ী স্যাম্পল নিন

    গ্র্যাব স্যাম্পল নির্দিষ্ট সময় ও পয়েন্টের অবস্থা দেখায়। কম্পোজিট স্যাম্পলে সময় বা ফ্লো অনুযায়ী একাধিক অংশ মেশানো হয়। পদ্ধতি ও অ্যানালাইট উপযোগী হলে ইন্টারনাল লোড অনুমানে এটি কাজে লাগে। রেগুলেটরি ডিসচার্জ পরীক্ষায় প্রযোজ্য বিধান ও সাইটের অনুমোদিত প্ল্যান অনুসরণ করুন। বাংলাদেশের পরিবেশ সংরক্ষণ বিধিমালা, ২০২৩-এর তফসিল ১২-তে বর্ণিত প্রযোজ্য ডিসচার্জ পরীক্ষার জন্য গ্র্যাব স্যাম্পলিং নির্ধারিত আছে।

    নিরাপদ ও অনুমোদিত অ্যাক্সেস ব্যবহার করুন। বোতল, ফিল্ড রিডিং, প্রিজারভেশন, পরিবহন ও হোল্ডিং টাইমের জন্য ল্যাবের নির্দেশনা অনুসরণ করুন। সংগ্রহকারী, স্যাম্পল পয়েন্ট ও আইডি, তারিখ-সময়, প্রসেস কন্ডিশন এবং প্রতিটি হ্যান্ডওভার লিখুন। রিপোর্টে একই আইডি, পদ্ধতি, একক এবং সিদ্ধান্তের উপযোগী রিপোর্টিং লিমিট যাচাই করুন।

    একটি স্যাম্পলের পথ

    ET-01-এ SP-301 পয়েন্টে ১৬:০০-এ O-16 গ্র্যাব স্যাম্পল রেকর্ড করা হলো। হ্যান্ডওভারে ফল অপেক্ষমাণ। রিপোর্ট এলে O-16-এর সঙ্গে মিলিয়ে পদ্ধতি ও একক যাচাই করুন, তারপর প্রযোজ্য শর্তের সঙ্গে তুলনা করুন। ফল বা স্যাম্পল রেকর্ডে ব্যবস্থা প্রয়োজন হলে সাইটের এসকেলেশন ও রিলিজ প্রসিডিউর অনুসরণ করুন।

    আরও পড়ুন · বাংলাদেশ গেজেট, পরিবেশ সংরক্ষণ বিধিমালা, ২০২৩

    ‹ আগের লেসন · অধ্যায়ের সূচি · পরের লেসন ›

  • 1.3.2 Effluent Sampling

    বাংলায় পড়ুন

    A lab result is useful when you can trace it back to the right water, at the right time, by the required method. Give the sample an identity before it leaves the sampling point.

    10-second illustration. Follow sample O-16 from its collection point to the matching lab report.

    Match the sample to the decision

    A grab sample describes a particular time and point. A composite sample combines increments over a time or flow period and can help estimate an internal load where the method and analyte allow it. For regulated discharge testing, follow the applicable requirements and the site’s approved plan. Schedule 12 of Bangladesh’s Environment Conservation Rules, 2023 specifies grab sampling for the applicable discharge testing described there.

    Use approved safe access. Follow the laboratory instructions for the bottle, field readings, preservation, transport, and holding time. Record the collector, sample point and ID, date and time, process conditions, and each handoff. Check the lab report for the same ID, method, units, and a reporting limit suitable for the decision.

    Follow one sample

    ET-01 records O-16 as a grab sample taken at SP-301 at 16:00. The handover shows the result as pending. When the lab report arrives, match it to O-16, check the method and units, and compare it with the applicable criterion. Use the site’s escalation and release procedure if the result or sample record calls for action.

    Further reading · Bangladesh Gazette, Environment Conservation Rules, 2023

    ‹ Previous lesson · Chapter contents · Next lesson ›

  • ১.২.২ নিরাপদ আইসোলেশন ও পুনরায় চালু

    Read in English

    স্ট্যান্ডবাই পাম্পে রান সিগন্যাল থাকলেও প্রয়োজনের চেয়ে কম পানি আসতে পারে। নিয়ন্ত্রিত টেস্টে নির্ধারিত ডিউটি পাওয়া গেলে এবং সাইটের প্রটেকশন সচল থাকলে মেরামত হ্যান্ডওভারের উপযোগী হয়।

    ১০ সেকেন্ডের অ্যানিমেশন। কাজের ক্রম এবং একই হেডে মেরামতের আগে ও পরের ফ্লো টেস্ট দেখুন।

    সাইটের কাজের ক্রম অনুসরণ করুন

    1. সমন্বয়। আউটেজ, ট্রিটমেন্ট চালু রাখার ব্যবস্থা, পারমিট ও দায়িত্ব নিয়ে অপারেশন ও মেইনটেন্যান্স একমত হয়।
    2. আইসোলেশন ও ভেরিফিকেশন। অনুমোদিত কর্মীরা সাইটের হ্যাজার্ডাস এনার্জি প্রসিডিউর প্রয়োগ করে আইসোলেশন ও স্টোরড এনার্জি নিয়ন্ত্রণ যাচাই করেন। স্টপ কমান্ড শুধু অপারেটিং স্ট্যাটাস জানায়। ট্যাংক ও পিটে অ্যাক্সেসের জন্য সাইটের কনফাইন্ড স্পেস প্রোগ্রাম অনুসরণ করুন।
    3. পুনরায় চালু ও টেস্ট। অনুমোদিত কর্মীরা কাজের জায়গা খালি করেন, সেফগার্ড ফেরান এবং অনুমোদিত রিটার্ন-টু-সার্ভিস টেস্ট করেন। কাজের আগে ও পরের রিডিং এবং অপারেশন হ্যান্ডওভার লিখুন।

    একটি পাম্প, দুটি রিডিং

    ET-01-এর উদাহরণে প্রায় ২২ m হেডে টেস্ট ব্যান্ড ৭৬–৮৪ m³/h। কাজের আগে P-102B একই হেডে ৫২ m³/h দিয়েছে। ওই ডিউটির জন্য পাম্পটি অনুপলব্ধ হিসেবে রেকর্ড হয়। সাকশন রেস্ট্রিকশন অনুমোদিত পদ্ধতিতে ঠিক করার পর একই হেডে ৭৯ m³/h পাওয়া গেল। ফ্লো শর্ত পূরণ হয়েছে। দায়িত্বপ্রাপ্ত ব্যক্তি সাইন-অফ দেওয়ার আগে বাকি শর্ত ও প্রটেকশন যাচাই করেন।

    আরও পড়ুন · হ্যাজার্ডাস এনার্জি কন্ট্রোলের OSHA টেকনিক্যাল রেফারেন্স

    ‹ আগের লেসন · অধ্যায়ের সূচি · পরের লেসন ›