Imagine taking over the morning shift. One ETP outlet COD reading stands out on the weekly chart. A WTP filter log, a work order and a pump test also need your attention. What would you write in the handover? Use the sample files to practice Excel as you work through that question.
Workbooks · Practice exercises · Checklists · References
Download the sample workbooks
Start with a log if you are new to Excel. Use the dashboard workbook when you are ready to follow a result across sheets. The data are fictional and workbook labels are in English. Work in a copy, edit the amber input cells and keep the formula cells.
- ETP Shift and Performance Log (.xlsx). Record flow, COD, pH and aeration DO by shift.
- WTP Filter and Water Quality Log (.xlsx). Track headloss, turbidity and backwash by filter. Keep plant outlet samples separate.
- Plant PM and Work Orders (.xlsx). Schedule preventive maintenance, assign work and record verification.
- Chemical Dosing and Operating Cost (.xlsx). Check stock feed, measured pump delivery and cost per cubic meter.
Dashboard workbook
Download the Excel dashboard workbook (.xlsx). Open Review Setup to choose the reporting week and review date. The three dashboards cover process performance, asset reliability, and operating cost and dosing.
Build a log the next shift can use
- Use one record per row. Use one row per shift, filter observation, backwash or outlet sample. Record the date, time or shift, sampling point, ID and units where applicable.
- Make the log easy to filter. Use Insert → Table, freeze the header, and add status drop-downs. Use conditional formatting to highlight readings for review.
- Give blanks and zeros distinct meanings. Leave a pending result blank and add a note. Enter zero when the measured value is zero.
Practice on a sample shift
1. Turn COD concentration into load
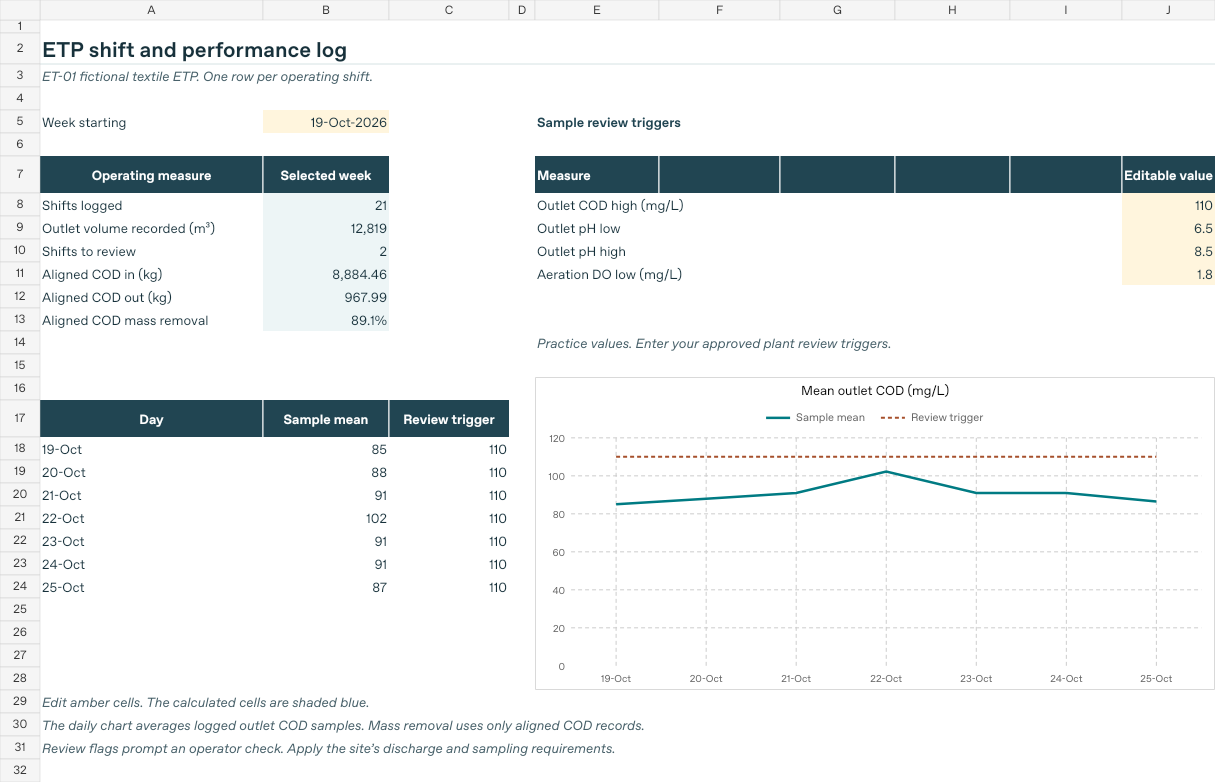
Open the ETP shift log. The first data row has 600 m³ of inlet volume in C9 and 700 mg/L of inlet COD in E9. Try the formula in a spare cell. What happens if you change the volume to 650 m³?
=IF(COUNT(C9,E9)=2,C9*E9/1000,"")
Check your result
The load rises from 420 to 455 kg. At 760 m³ and 900 mg/L, it would be 684 kg. Now clear the outlet COD in the same sample row and watch how it drops out of the weekly paired removal calculation. Use comparable inlet and outlet intervals when calculating mass removal.
2. Follow a chart peak to the record
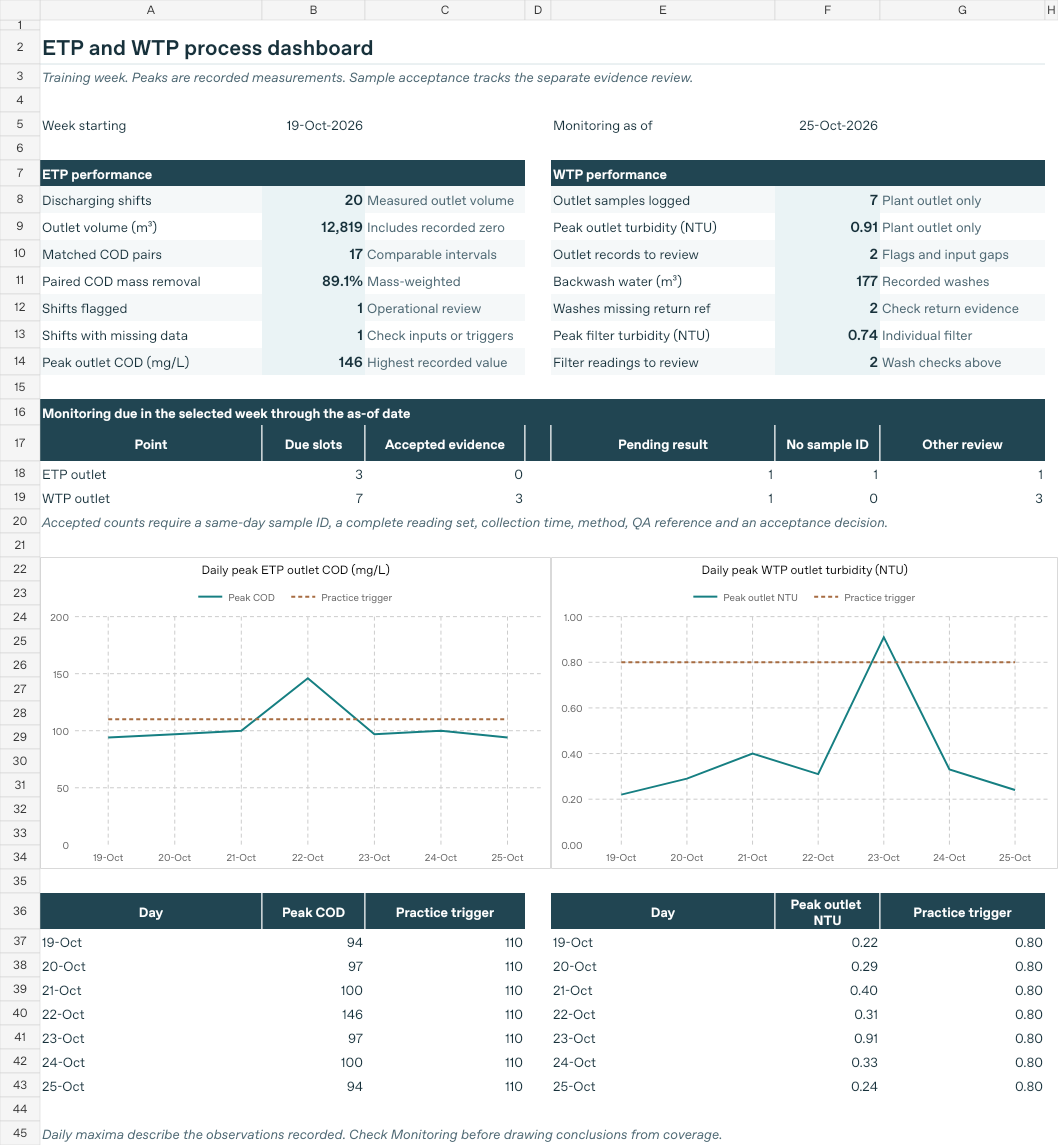
Open the Process dashboard and find the 146 mg/L outlet COD peak on October 22. In ETP Log, filter Screen state to Review and identify the shift. Then find the basis of the weekly 89.1% COD mass removal. It uses 17 matched inlet and outlet pairs across 20 discharging shifts. Compare the WTP outlet trend with individual filter readings and check the sampling point each time.
In Monitoring, filter Evidence state to Pending result and use the sample IDs to find the source rows. Try COUNTIFS to count records by status and SUMIFS to total volumes for a date range.
See the sample dashboard
3. Work out what to hand over
In the Reliability dashboard, open Actions and compare WO-204 with CA-102. Look at the work date, verification date, reviewer and reference. Move the review date back a day and see which action still needs follow-up. For extra practice, use a PivotTable to summarize open work by owner or backwash volume by filter.
4. Check a unit cost and a pump test
The sample week shows 0.69 kWh/m³ in specific energy use and BDT 14.74/m³ in combined energy and chemical cost. Trace the totals and treated volumes for the matching intervals. In Cost and Dosing, change the measured test volume from 490 to 500 mL and leave the test duration at 60 seconds. Delivery calculated from the test moves from 29.40 to 30.00 L/h.
Try writing the handover. Pick one reading or action from the exercises. Write down what you found, the row or ID that supports it, and who should check what next.
Checklists for plant O&M
Download the fillable checklists (.xlsx). Save a copy for each shift, round, work order or review. Note the source record and give each action an owner and follow-up time. Use your plant’s approved procedures and criteria in live work.
ETP shift rounds and handover
- Read the last handover. Confirm active trains, inlet and outlet volumes, equalization level, and any held flows.
- Check the equipment, aeration DO, and solids separation from designated observation points. Log each sample by point, time, and ID.
- Carry forward alarms, pending results, and unresolved issues with an owner and a check-back time.
WTP rounds and water quality
- Record active trains, feed and product flow, and filter status. Track headloss and turbidity by filter ID.
- Log backwash events and return-to-service checks. Keep individual filter results separate from plant outlet samples.
- Record missing tests and readings outside your plant’s triggers. Follow the escalation procedure.
Maintenance planning and closeout
- Match the job to the asset tag, due date, and assigned person. Confirm applicable permits and isolation with authorized staff.
- Record the work, post-work test result, and verification reference. Confirm return-to-service authorization where required.
- Update the asset history and next preventive maintenance date after verified closeout.
Excel log and weekly report review
- Check dates, units, sample IDs, duplicates, and gaps. Keep a pending result blank and add a note.
- Check that formulas cover new rows. Reconcile volume totals and use matched intervals for COD mass removal.
- Verify dosing and cost use the right chemical and volume bases. Review flagged readings before sharing summary averages.
References and further practice
Excel Tables · SUMIFS · PivotTables · COD load and equalization
Standards and plant guides
- Bangladesh requirements. Environment Conservation Rules, 2023
- Asset management and performance. ISO 55001:2024 · EPA asset management guide · EPA guide PDF · EPA EUM Primer · ISO 24511:2024 · ISO 24512:2024
- Sampling, drinking-water safety and filtration. ISO 5667-10 · ISO 5667-3 · WHO Water Safety Plan Manual · EPA turbidity guidance
- Energy indicators and baselines. ISO 50006:2023
Leave a Reply