Category: Water, Wetlands & Rivers

  • তুরাগ নদীর এনভায়রনমেন্টাল ফ্লো ও মৌসুমি পরিবর্তন

    Read in English · হোমপেজ

    তুরাগে কত পানি থাকা দরকার? প্রশ্নটি দরকারি, তবে উত্তর দিতে স্থান, মৌসুম ও উদ্দেশ্য জানতে হবে। চ্যানেলে পানি টিকে থাকলেও হ্যাবিট্যাটে চাপ থাকতে পারে। লো ফ্লো কখন হয় এবং কতক্ষণ থাকে সেটিও গুরুত্বপূর্ণ।

    তুরাগ নিয়ে প্রকাশিত গবেষণার রিভিউ এবং উত্তরা দিয়াবাড়ির কাছে টঙ্গী ব্রিজ এলাকার সঙ্গে যুক্ত আর্কাইভ করা ২০০৬–২০২৫ সালের GEOGLOWS ডিসচার্জের আটটি সিনারিও একত্র করেছি। এতে নদীর বাস্তব প্রেক্ষাপট বজায় রেখে এনভায়রনমেন্টাল ফ্লোর সংখ্যা পড়ার উপায় বোঝা যায়।
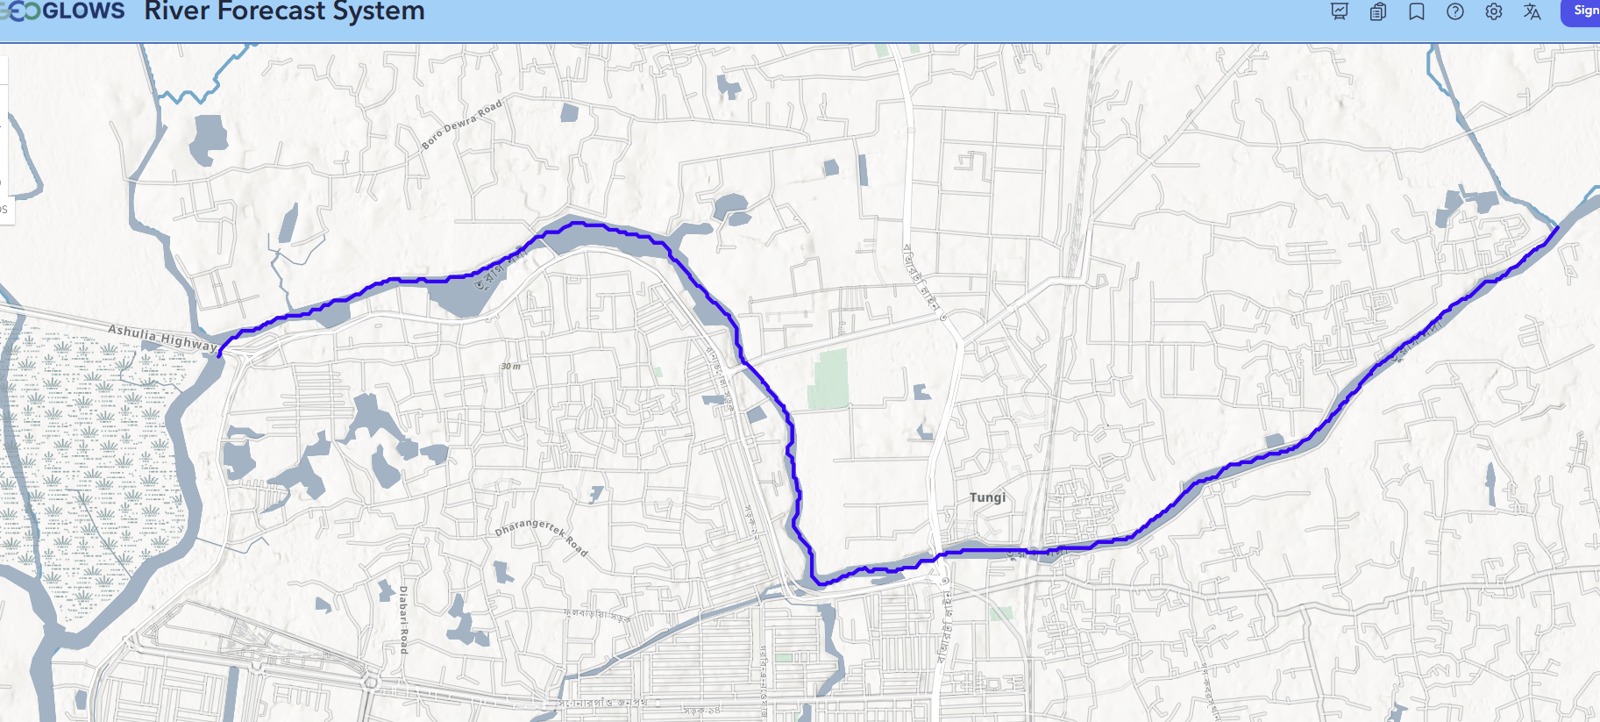
    টঙ্গী ব্রিজ রেফারেন্স এলাকার কাছে তুরাগ–টঙ্গী নেটওয়ার্কের নির্বাচিত মডেল সেগমেন্ট। বিশ্লেষণের ডকুমেন্ট থেকে নেওয়া ম্যাপে GEOGLOWS ইন্টারফেস ও বেসম্যাপের ক্রেডিট রাখা হয়েছে।
    টঙ্গী ব্রিজ রেফারেন্স এলাকার কাছে তুরাগ–টঙ্গী নেটওয়ার্কের নির্বাচিত মডেল সেগমেন্ট। বিশ্লেষণের ডকুমেন্ট থেকে নেওয়া ম্যাপে GEOGLOWS ইন্টারফেস ও বেসম্যাপের ক্রেডিট রাখা হয়েছে।

    প্রকাশিত হিসাবগুলো কেন আলাদা

    তুরাগের আগের গবেষণাগুলোতে স্টেশন, রেকর্ড ও পদ্ধতি আলাদা। রহমান ও সহকর্মীদের ২০১৩ সালের গবেষণায় নির্বাচিত RVA মান ২০৬.৫০, FDC মান ১৮০.৭৭ এবং Tennant সিনারিওর মান ১৯০.৮৮ m³/s। সংখ্যাগুলো ওই গবেষণার স্থান ও রেফারেন্স ডেটার সঙ্গে যুক্ত। ছোট একটি সংযুক্ত রিচে একই সংখ্যা বসালে হিসাবের মূল প্রশ্নগুলো বাদ পড়ে যায়।

    পদ্ধতিকী সংক্ষেপ করেযে প্রশ্ন করবেন
    Tennantদীর্ঘমেয়াদি গড় ফ্লোর নির্বাচিত অংশকোন হ্যাবিট্যাট সিনারিও ও মৌসুমি কোয়েফিশিয়েন্ট নেওয়া হয়েছে?
    মান্থলি অ্যালোকেশনমাসিক গড় বা মিডিয়ান ফ্লোর অংশলো ও হাই ফ্লোর মাস কীভাবে নির্ধারিত?
    ফ্লো ডিউরেশন কার্ভ বা FDCনির্দিষ্ট সময়ের অংশে সমান বা বেশি থাকা ফ্লোকোয়ান্টাইল পুরো বছর নাকি এক মৌসুমের?
    রেঞ্জ অব ভ্যারিয়েবিলিটি অ্যাপ্রোচ বা RVAরেফারেন্স ফ্লোর বৈশিষ্ট্য থেকে বিচ্যুতিবেসলাইন ও টার্গেট রেঞ্জ কী?

    Q90 একটি এক্সিডেন্স স্ট্যাটিস্টিক। নির্বাচিত রেকর্ডের প্রায় ৯০% সময়ে সমান বা বেশি থাকা ফ্লো বোঝায়। কার্ভ থেকে ফ্রিকোয়েন্সি বোঝা যায়। লো ফ্লোর দিনগুলো একটানা ছিল কি না দেখতে আলাদা টাইমলাইন দরকার।

    ২০ বছরের তুলনায় কী পাওয়া গেছে

    আর্কাইভ সিরিজে ২০০৬–২০২৫ সালের ৭,৩০৫টি দৈনিক মডেলড মান আছে। গড় ১৯.৫১ m³/s। প্রথম দশকের গড় ২০.৩৮ এবং দ্বিতীয় দশকের ১৮.৬৪ m³/s, অর্থাৎ তুলনায় ৮.৫৫% কম। তবে বার্ষিক ট্রেন্ড টেস্টে p = 0.319। তাই দুই সময়ের গড়ের পার্থক্য বোঝা যায়, কিন্তু স্থায়ী বার্ষিক ট্রেন্ডের প্রমাণ সীমিত।
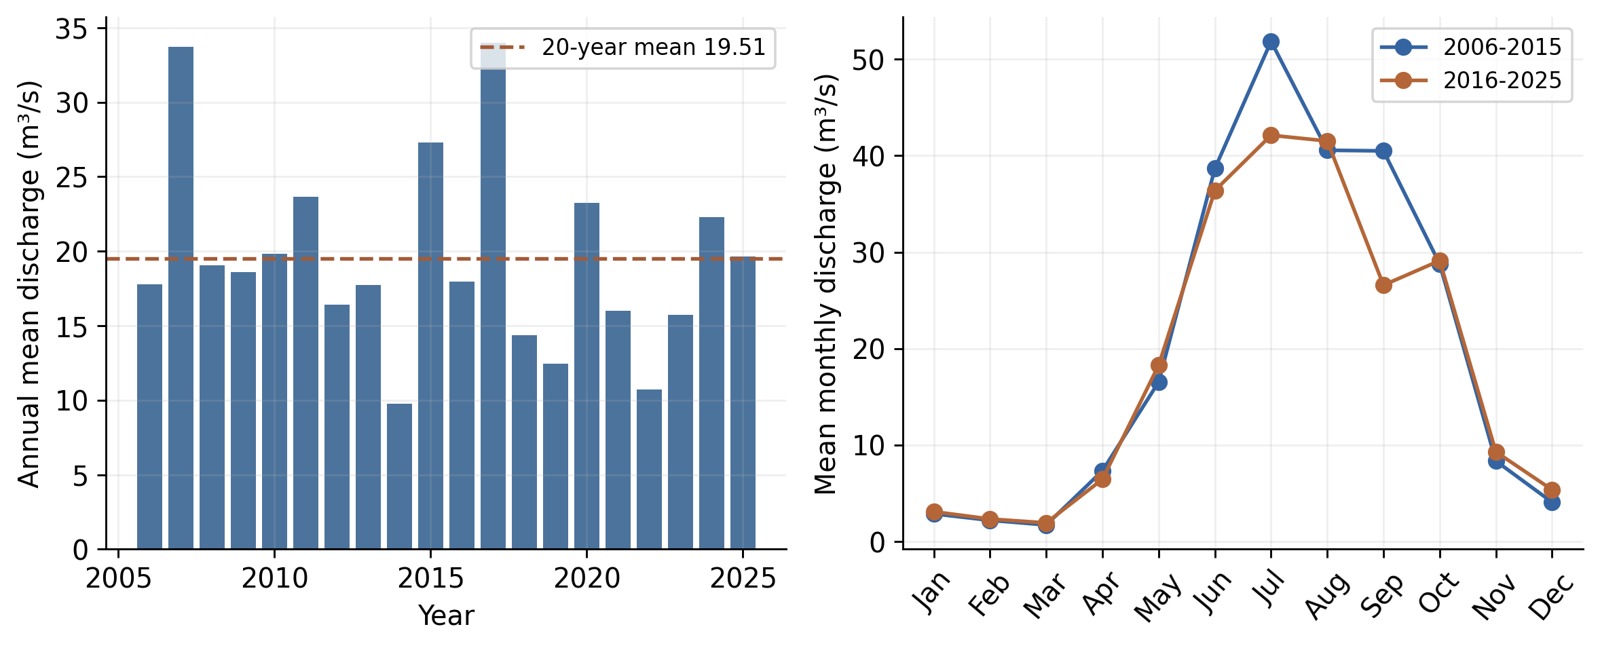
    আর্কাইভ করা ২০০৬–২০২৫ মডেলড সিরিজের বার্ষিক গড় ও মাসভিত্তিক প্যাটার্ন। বিশ্লেষণের ডকুমেন্ট থেকে নেওয়া। সংখ্যাগুলো নির্বাচিত মডেল রেকর্ডের ফল।
    আর্কাইভ করা ২০০৬–২০২৫ মডেলড সিরিজের বার্ষিক গড় ও মাসভিত্তিক প্যাটার্ন। বিশ্লেষণের ডকুমেন্ট থেকে নেওয়া। সংখ্যাগুলো নির্বাচিত মডেল রেকর্ডের ফল।

    শুধু বার্ষিক গড়ের চেয়ে মৌসুমি চিত্র বেশি তথ্য দেয়। বিশ্লেষণে ব্যবহৃত একই লো-ফ্লো মাসের গ্রুপে দুই দশকের মধ্যে গড় ফ্লো ৫.৬৪% বেড়েছে। হাই-ফ্লো মৌসুমের গড় ১০.৪৪% কমেছে। বার্ষিক গড় কমার পাশাপাশি শুকনা মৌসুমের গড় বাড়তেও পারে।

    আট পদ্ধতিতে আটটি সম্ভাব্য শিডিউল

    তুলনায় আছে Tennant good ও fair, Tessmann, variable monthly flow, modified constant yield, দুটি FDC শিডিউল এবং moderate-status Smakhtin adaptation। বার্ষিক গড় থ্রেশহোল্ড ৩.২৬–৯.০৮ m³/s। নির্বাচিত থ্রেশহোল্ডের নিচে থাকা ঐতিহাসিক দিনের হার ১৫.২৯–৪৭.২৮%।
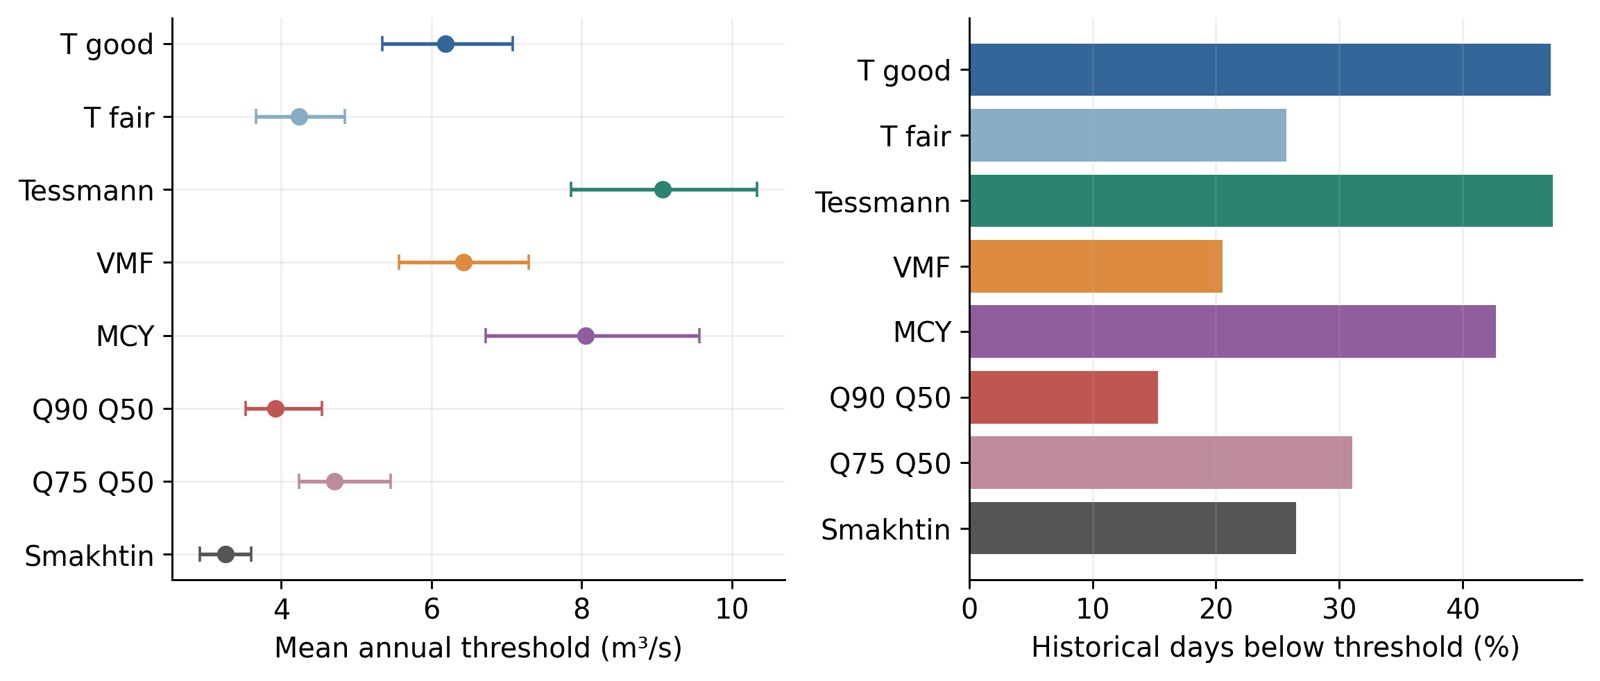
    আটটি সিনারিওতে সম্ভাব্য বার্ষিক গড় থ্রেশহোল্ড এবং ঐতিহাসিকভাবে তার নিচে থাকা দিনের হার। মূল বিশ্লেষণ থেকে নেওয়া। এরর বার আর্কাইভ সিরিজের স্যাম্পলিং অনিশ্চয়তা দেখায়। স্থানীয় মডেল ও ইকোলজিক্যাল অনিশ্চয়তা আলাদা।
    আটটি সিনারিওতে সম্ভাব্য বার্ষিক গড় থ্রেশহোল্ড এবং ঐতিহাসিকভাবে তার নিচে থাকা দিনের হার। মূল বিশ্লেষণ থেকে নেওয়া। এরর বার আর্কাইভ সিরিজের স্যাম্পলিং অনিশ্চয়তা দেখায়। স্থানীয় মডেল ও ইকোলজিক্যাল অনিশ্চয়তা আলাদা।

    এই বিস্তার পদ্ধতি নির্বাচনের প্রভাব দেখায়। ছোট থ্রেশহোল্ড নিলে আপাত ঘাটতি কমবে, বড় নিলে বাড়বে। কোনটি বেছে নেওয়া যুক্তিসংগত, তা নির্ধারণে ম্যানেজমেন্টের উদ্দেশ্য এবং স্থানীয় ডেপথ, ভেলোসিটি, হ্যাবিট্যাট ও পানির মানের প্রমাণ দরকার।

    ফ্লো ও দূষণের প্রমাণ মিলিয়ে দেখুন

    ডিসচার্জ নদীর অবস্থার একটি অংশ। ওয়েস্টওয়াটার লোড, ডিজলভড অক্সিজেন, চ্যানেলের আকৃতি, ব্যাকওয়াটার ও হ্যাবিট্যাট সংযোগও ফলকে প্রভাবিত করে। ফ্লো বাড়লে দূষকের কনসেনট্রেশন বদলাতে পারে। নদী ব্যবস্থাপনায় ট্রিটমেন্ট ও সোর্স কন্ট্রোলও প্রয়োজনীয়।

    স্থানীয় অনুসন্ধানে আমি ডিসচার্জ বা স্টেজ পর্যবেক্ষণ, ক্রস-সেকশন, উইথড্রয়াল রেকর্ড, মৌসুমি পানির মান ও হ্যাবিট্যাট পর্যবেক্ষণ একত্র করব। লো-ফ্লো পর্ব কখন হয় এবং কতক্ষণ চলে তাও রাখব। এতে থ্রেশহোল্ডকে নদীতে যাচাইযোগ্য প্রশ্নে পরিণত করা যায়।

    ফল সঠিক স্কেলে ব্যবহার করুন

    ফলগুলো আর্কাইভ মডেল এক্সপোর্ট থেকে পাওয়া হাইড্রোলজিক্যাল স্ক্রিনিং। অপারেশনে ব্যবহারের আগে সঠিক মডেল-রিচ আইডি ও স্থানীয় বায়াস নিশ্চিত করতে হবে। প্রকাশিত স্টেশনের মান এবং মডেল-রিচের মান নিজস্ব পরিচয়েই রাখতে হবে। এরপর স্থানীয় মনিটরিং দিয়ে দেখা যাবে কোন মৌসুমি শিডিউল কাঙ্ক্ষিত ফাংশনগুলো রক্ষা করতে পারে।

    উৎস ও আরও পড়ার উপকরণ

    GEOGLOWS রেট্রোস্পেকটিভ ডেটার ডকুমেন্টেশন মডেলড ডিসচার্জ ব্যাখ্যা করে। আলী ও হাসানের গড়াই নদীর তুলনা একাধিক পদ্ধতির কাঠামো দেয়। পাস্টর ও সহকর্মীরা এনভায়রনমেন্টাল ফ্লো পদ্ধতি আলোচনা করেছেন। রিভিউতে রহমান ও সহকর্মী (২০১৩), DOI 10.12983/ijsres-2013-p291-299, এবং তাসনিম ও সহকর্মীদের স্টেশনভিত্তিক প্রিপ্রিন্ট (২০২৩), DOI 10.22541/essoar.167326693.37637161/v1-ও ব্যবহৃত হয়েছে।

    দিয়াবাড়ির ওয়াটারলগিং ও সলিড ওয়েস্ট ম্যানেজমেন্ট · দিয়াবাড়ির ওয়েটল্যান্ড, ড্রেনেজ ও হ্যাবিট্যাট সুরক্ষা
    হোমপেজে ফিরুন · English version

  • Turag River Environmental Flow and Seasonal Change

    বাংলায় পড়ুন · Home

    How much water should remain in the Turag? It is a useful question, but the answer needs a place, a season, and a purpose. A flow that maintains a wetted channel may still leave habitat under stress. The timing and duration of low flow also matter.

    I combined my review of published Turag studies with an eight-scenario comparison of an archived 2006–2025 GEOGLOWS discharge series associated with the Tongi Bridge area near Uttara Diabari. Together, they show how to read environmental-flow numbers without losing the river behind them.

    Selected model segment in the Turag–Tongi network, with Tongi Bridge as the reference area
    Selected model segment in the Turag–Tongi network, with Tongi Bridge as the reference area. Map extracted from the analysis document; GEOGLOWS interface and basemap attribution are retained.

    Why published estimates differ

    Earlier Turag work uses different stations, records, and rules. Rahman and colleagues’ 2013 paper reported selected values of 206.50 m³/s for its Range of Variability Approach, 180.77 m³/s for its flow-duration approach, and 190.88 m³/s for its selected Tennant scenario. Those values belong to that study’s location and reference data. Applying them unchanged to a smaller connected reach would skip the questions that produced them.

    MethodWhat it summarizesQuestion to ask
    TennantA selected proportion of long-term mean flowWhich habitat scenario and seasonal coefficients were chosen?
    Monthly allocationA share of mean or median monthly flowHow were low and high months defined?
    Flow duration curve (FDC)The flow equaled or exceeded for a stated share of timeDoes the quantile use the whole year or one season?
    Range of Variability Approach (RVA)Departure from reference flow characteristicsWhat baseline and target range were used?

    Q90 is an exceedance statistic. It represents a flow equaled or exceeded about 90% of the time in the selected record. The curve summarizes frequency; a separate timeline is needed to see whether low-flow days occurred together.

    What the 20-year comparison shows

    The archived series contains 7,305 daily modeled values for 2006–2025. Its mean is 19.51 m³/s. The first decade averages 20.38 m³/s and the second 18.64 m³/s, a descriptive reduction of 8.55%. Yet the annual trend test gives p = 0.319. The record therefore supports a difference between the two period averages, while providing limited evidence for a persistent annual trend.

    Annual means and monthly patterns from the archived 2006–2025 modeled series
    Annual means and monthly patterns from the archived 2006–2025 modeled series. Extracted from the analysis document. These values describe the selected model record.

    The seasonal picture is more informative than the annual average alone. Under the common low-flow month grouping used in the analysis, mean low-season flow rises by 5.64% between decades, while mean high-season flow falls by 10.44%. A lower annual mean can coexist with a higher dry-season mean.

    Eight methods produce eight candidate schedules

    The comparison includes Tennant good and fair scenarios, Tessmann, variable monthly flow, modified constant yield, two FDC schedules, and a moderate-status Smakhtin adaptation. Their annual mean thresholds range from 3.26 to 9.08 m³/s. Historical days below the chosen thresholds range from 15.29% to 47.28%.

    Candidate annual mean thresholds and historical below-threshold frequencies for eight scenarios
    Candidate annual mean thresholds and historical below-threshold frequencies for eight scenarios. Extracted from the analysis document. Error bars reflect sampling within the archived series, while local model and ecological uncertainty remain separate.

    This spread is a finding about method choice. Selecting the smallest threshold would lower the apparent deficit, while selecting a larger one would increase it. A sensible choice needs a management objective and evidence about local depth, velocity, habitat, and water quality.

    Combine flow and pollution evidence

    Discharge is only one part of river condition. Wastewater load, dissolved oxygen, channel shape, backwater effects, and habitat connections also influence outcomes. Higher flow can change pollutant concentration, but treatment and source control remain necessary parts of river management.

    For a local investigation, I would assemble discharge or stage observations, cross-sections, withdrawal records, seasonal water quality, and habitat observations. I would also record how long low-flow episodes last and when they occur. That turns a threshold into a question that can be checked on the river.

    Use the results at the right scale

    These are hydrological screening results from an archived model export. The export’s exact model-reach identifier and location-specific bias need confirmation before operational use. Published station values and model-reach values should retain their own labels. Local monitoring can then test which candidate seasonal schedule protects the functions people want to retain.

    Sources and further reading

    GEOGLOWS retrospective-data documentation explains the modeled discharge product. Ali and Hasan’s Gorai comparison provides the multi-method framework. Pastor and colleagues discuss environmental-flow methods. The literature review also uses Rahman et al. (2013), DOI 10.12983/ijsres-2013-p291-299, and the station-based preprint by Tasnim et al. (2023), DOI 10.22541/essoar.167326693.37637161/v1.

    Diabari Waterlogging and Solid Waste Management · Diabari Wetlands, Drainage and Habitat Protection

    Back to Home · বাংলা সংস্করণ

  • দিয়াবাড়ির ওয়েটল্যান্ড, ড্রেনেজ ও হ্যাবিট্যাট সুরক্ষা
    Read in English · হোমপেজ

    নতুন রাস্তার পাশে মৌসুমে ভেজা একটি খোলা জায়গা অব্যবহৃত জমি মনে হতে পারে। বৃষ্টির সময় সেটি এলাকার স্টোরেজ ও ড্রেনেজ সিস্টেমের অংশ হতে পারে। পাখি, অ্যামফিবিয়ান ও অন্য প্রাণীর জন্য একই জায়গা খাবার, আশ্রয় ও প্রজননের হ্যাবিট্যাটকে যুক্ত করতে পারে।

    দিয়াবাড়ির কাজটিতে পুরোনো ইমেজারি, ইকোলজিক্যাল রেকর্ড এবং এনভায়রনমেন্টাল অ্যান্ড সোশ্যাল ইমপ্যাক্ট অ্যাসেসমেন্ট বা ESIA-এর পদ্ধতি একসঙ্গে ব্যবহার করেছি। প্রস্তাবিত পরিবর্তন কোন সংযোগে বাধা দেবে এবং তা কীভাবে এড়ানো যায়—এটাই ব্যবহারিক প্রশ্ন।

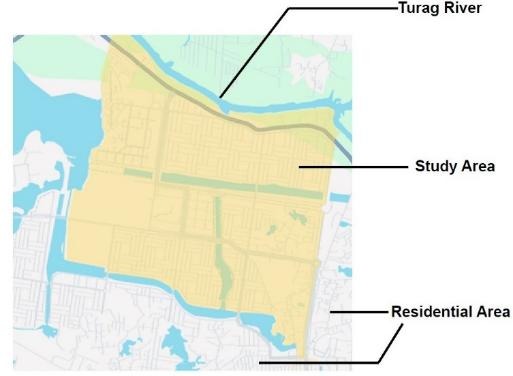
    তুরাগ নদী ও আবাসিক এলাকার পাশে দিয়াবাড়ির স্টাডি এরিয়া। মূল ডকুমেন্ট থেকে নেওয়া ম্যাপ, সেখানে রিভার অ্যান্ড ডেল্টা রিসার্চ সেন্টার (২০২৬)-কে ক্রেডিট দেওয়া হয়েছে।
    তুরাগ নদী ও আবাসিক এলাকার পাশে দিয়াবাড়ির স্টাডি এরিয়া। মূল ডকুমেন্ট থেকে নেওয়া ম্যাপ, সেখানে রিভার অ্যান্ড ডেল্টা রিসার্চ সেন্টার (২০২৬)-কে ক্রেডিট দেওয়া হয়েছে।

    সংযুক্ত ল্যান্ডস্কেপটি পড়ুন

    ওয়েটল্যান্ডের কাজ শুধু তার সীমানার ওপর নির্ভর করে না। পানি কোথা দিয়ে ঢোকে, কোন লেভেলে বের হয় এবং প্যাচগুলোর মধ্যে কোন রাস্তা বা ক্রসিং আছে দেখুন। বড় পানির অংশ ম্যাপে দেখা গেলেও বাকি ছোট চ্যানেলটি গুরুত্বপূর্ণ হতে পারে।

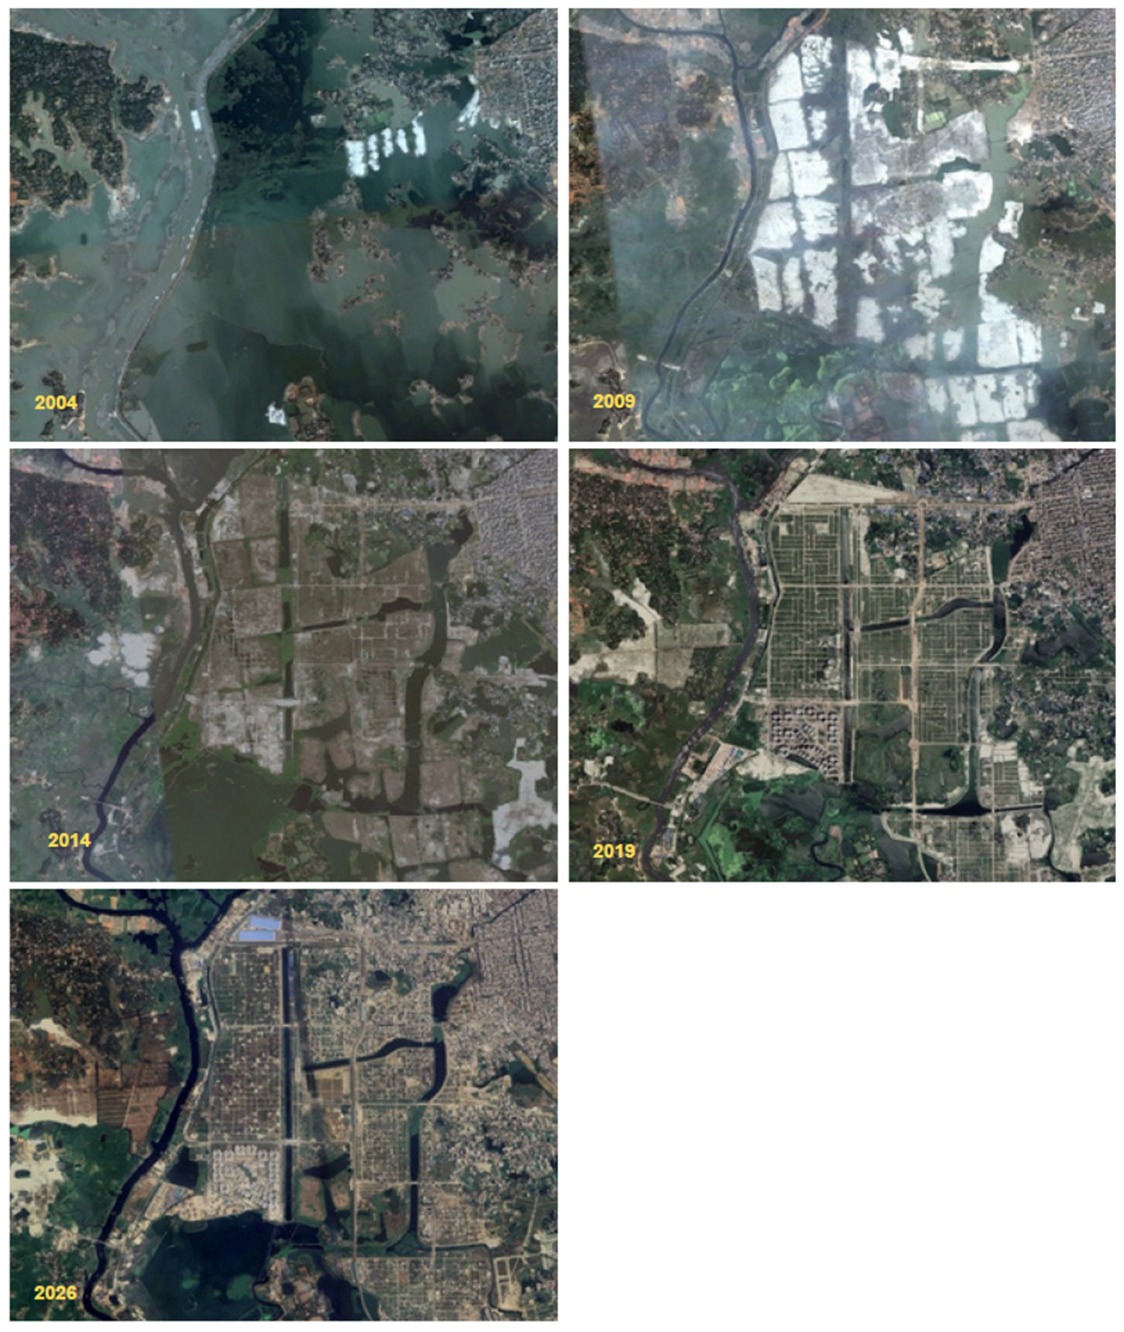
    তুলনীয় মৌসুমের ইমেজ ব্যবহার করুন। শুকনা মৌসুমের সঙ্গে মনসুনের ইমেজ তুলনা করলে স্বাভাবিক মৌসুমি পরিবর্তনও স্থায়ী ক্ষতি মনে হতে পারে। ক্লাউড, মিক্সড পিক্সেল, পানির উদ্ভিদ ও খালি মাটিও ব্যাখ্যায় প্রভাব ফেলে। রিমোট সেন্সিং সাইটে যাচাইয়ের প্রশ্ন চিহ্নিত করতে সাহায্য করে।

    ল্যান্ডস্কেপের পরিবর্তন বোঝাতে মূল উপকরণ থেকে নেওয়া বিভিন্ন সময়ের ইমেজ প্যানেল। মূল ডকুমেন্টে ক্রেডিট রিভার অ্যান্ড ডেল্টা রিসার্চ সেন্টার (২০২৬)। তুলনার সময় মৌসুম ও ইমেজ রেজল্যুশন দেখতে হবে।
    ল্যান্ডস্কেপের পরিবর্তন বোঝাতে মূল উপকরণ থেকে নেওয়া বিভিন্ন সময়ের ইমেজ প্যানেল। মূল ডকুমেন্টে ক্রেডিট রিভার অ্যান্ড ডেল্টা রিসার্চ সেন্টার (২০২৬)। তুলনার সময় মৌসুম ও ইমেজ রেজল্যুশন দেখতে হবে।

    ম্যাপ থেকে ইমপ্যাক্টের প্রশ্ন তৈরি করুন

    চাপসাইটের জন্য প্রশ্নপ্রয়োজনীয় প্রমাণ
    জমি ভরাটসরে যাওয়া বৃষ্টির পানি কোথায় জমবে?গ্রাউন্ড লেভেল, স্টোরেজ এরিয়া ও সংযুক্ত আউটলেট
    নতুন রাস্তা বা ক্রসিংপানি ও প্রাণী কি প্যাচগুলোর মধ্যে চলতে পারবে?কালভার্টের লেভেল, ফ্লো পাথ ও হ্যাবিট্যাট সংযোগ
    বর্জ্য ফেলাসংগ্রহ ও ডিসপোজালের ব্যবস্থা নির্ভরযোগ্য কি?একই স্থানের ধারাবাহিক ছবি ও সংগ্রহের রেকর্ড
    বিনোদন ও যান চলাচলকোন সেনসিটিভ জায়গায় কম বিরক্তিকর অ্যাক্সেস দরকার?হ্যাবিট্যাট রেকর্ড ও স্থানীয় ব্যবহারকারীদের সঙ্গে আলোচনা

    মিটিগেশনের ক্রম অনুসরণ করুন

    • লেআউটে গুরুত্বপূর্ণ ওয়েটল্যান্ড প্যাচ ও ড্রেনেজ সংযোগ রেখে ক্ষতি এড়ান।
    • নিয়ন্ত্রিত অ্যাক্সেস, নিয়মিত বর্জ্য সংগ্রহ ও নির্দিষ্ট কনস্ট্রাকশন বাউন্ডারি দিয়ে বিরক্তি কমান।
    • উপযুক্ত নেটিভ ভেজিটেশন ও মেইনটেন্যান্স অ্যাক্সেস রেখে ক্ষতিগ্রস্ত পাড় ও ফ্লো পাথ রিস্টোর করুন।
    • যে ইমপ্যাক্ট থেকে যায়, তার জন্য মনিটরযোগ্য ব্যবস্থা নিন। বিকল্প গ্রিন প্যাচে আগের কোন ফাংশন ফিরছে তা মূল্যায়ন করুন।

    পরিকল্পনার শুরুতেই এই ক্রম কাজে লাগাতে হবে। জমি ভরাট ও আউটফল ডেভেলপমেন্টের নিচে চাপা পড়ার পরে বিকল্প কমে যায়, খরচও বাড়ে।

    এলাকার ব্যবহারকারীদের কথা শুনুন

    বাসিন্দারা বারবার পানি জমা, চলাচলের অসুবিধা, ডাম্পিং ও পরিবর্তনের এমন তথ্য দিতে পারেন যা একটি ইমেজে ধরা পড়ে না। স্থানীয় ইকোলজিক্যাল রেকর্ড দিয়ে কোন হ্যাবিট্যাটে আরও মনোযোগ দরকার বোঝা যায়। এই কাজে ব্যবহৃত কমিউনিটি রেকর্ড প্রেক্ষাপট দেয়। প্রকল্পের সিদ্ধান্তের জন্য ক্ষতিগ্রস্ত বাসিন্দাদের সঙ্গে সরাসরি আলোচনা ও সাইট সার্ভে দরকার।

    কাজের পরে ফাংশন মাপুন

    কতক্ষণ পানি থাকে, চ্যানেলের সংযোগ দৃশ্যমান কি না, আবার ডাম্পিং হচ্ছে কি না, গাছ টিকছে কি না এবং মৌসুমি হ্যাবিট্যাটের পর্যবেক্ষণ নিয়ে ছোট মনিটরিং রেকর্ড রাখুন। একই লোকেশন ব্যবহার করে তারিখ ও অবস্থা লিখুন। প্রাণীর উপস্থিতি ইকোলজিক্যাল তথ্য দেয়। পানির মান সম্পর্কে সিদ্ধান্তে উপযুক্ত স্যাম্পলিং ও ল্যাব প্রমাণ দরকার।

    আমার ব্যবহারিক মত

    আমি আগে সংযুক্ত পানির পথ ও তার আশপাশের ওয়েটল্যান্ড প্যাচ রক্ষায় জোর দেব। এরপর প্রস্তাবিত অ্যাক্সেস, বর্জ্য সংগ্রহ ও রিস্টোরেশন নিয়মিত চালানো সম্ভব কি না দেখব। ডেস্ক রিভিউ এসব অগ্রাধিকার নির্ধারণে সাহায্য করে। বিস্তারিত ডেভেলপমেন্ট সিদ্ধান্তে সাইট লেভেল, মৌসুমি পর্যবেক্ষণ ও আলোচনা দরকার।

    উৎস ও আরও পড়ার উপকরণ

    ফিগার ও স্থানীয় ইকোলজিক্যাল তথ্যের উৎস রিভার অ্যান্ড ডেল্টা রিসার্চ সেন্টারের Biodiversity in Diabari: Periurban Nature in Dhaka (২০২৬) এবং মূল ডকুমেন্টে উল্লিখিত কমিউনিটি রেকর্ড। বৃহত্তর ড্রেনেজ প্রেক্ষাপটের জন্য উত্তর ঢাকার আরবানাইজেশন ও প্লুভিয়াল ফ্লাডিং গবেষণাটি পড়ুন।

    দিয়াবাড়ির ওয়াটারলগিং ও সলিড ওয়েস্ট ম্যানেজমেন্ট · তুরাগ নদীর এনভায়রনমেন্টাল ফ্লো ও মৌসুমি পরিবর্তন

    হোমপেজে ফিরুন · English version

  • Diabari Wetlands, Drainage and Habitat Protection

    বাংলায় পড়ুন · Home

    An open, seasonally wet patch beside a new road can look like unused land. During rain, it may become part of the neighborhood’s storage and drainage system. For birds, amphibians, and other wildlife, the same patch can connect feeding, shelter, and breeding habitat.

    My Diabari work combines historical imagery, ecological records, and an environmental and social impact assessment (ESIA) approach. The useful question is what a proposed change would interrupt, and how that interruption could be avoided.

    Diabari study area beside the Turag River and residential development
    Diabari study area beside the Turag River and residential development. Extracted from the source document, which credits the River & Delta Research Centre (2026).

    Read the connected landscape

    A wetland’s function depends on more than its boundary. Look for the route by which water enters, the level at which it leaves, and the roads or crossings between patches. A small remaining channel can be important even when the larger water body is still visible on a map.

    Use images from comparable seasons. A dry-season image and a monsoon image can make normal seasonal change look like permanent loss. Cloud cover, mixed pixels, aquatic vegetation, and bare soil also affect interpretation. Remote sensing helps locate questions for site verification.

    Historical image panels retained from the source materials to illustrate landscape change
    Historical image panels retained from the source materials to illustrate landscape change. Credit in the source document: River & Delta Research Centre (2026). Different seasons and image resolutions should be considered when comparing panels.

    Turn a map into an impact question

    PressureQuestion for the siteUseful evidence
    Land fillingWhere will the displaced rainfall collect?Ground levels, storage area, and connected outlets
    A new road or crossingCan water and wildlife still move between patches?Culvert levels, flow paths, habitat connections
    Waste dumpingIs access to collection and disposal reliable?Repeated photographs and collection records
    Recreation and vehicle movementWhich sensitive places need quieter access?Habitat records and consultation with local users

    Apply the mitigation order

    • Avoid damage by retaining the most important wetland patches and drainage connections in the layout.
    • Minimize disturbance through controlled access, reliable waste collection, and a defined construction boundary.
    • Restore damaged edges and flow paths with appropriate native vegetation and maintenance access.
    • Address residual impacts through measures that can be monitored. A replacement green patch should be assessed against the functions that were lost.

    This order belongs early in planning. Once the land is filled and the outfall is hidden beneath development, the options become narrower and more expensive.

    Listen to the people who use the place

    Residents can describe recurring waterlogging, access difficulties, dumping, and changes that a single image misses. Local ecological records can show which habitats deserve closer attention. The community records reviewed for this work provide context; direct discussion with affected residents and site surveys are still needed for a project decision.

    Measure functions after the work

    Keep a small monitoring record for waterlogging duration, visible channel connections, repeat dumping, vegetation survival, and seasonal habitat observations. Use the same locations and record the date and conditions. Species presence is useful ecological context, while water-quality claims need suitable sampling and laboratory evidence.

    My practical view

    I would begin by protecting the connected water route and the wetland patches around it. Then I would check whether the proposed access, waste collection, and restoration arrangements can be maintained. The desk review helps set those priorities; a detailed development decision needs site levels, seasonal observations, and consultation.

    Sources and further reading

    The figures and local ecological context come from the River & Delta Research Centre’s Biodiversity in Diabari: Periurban Nature in Dhaka (2026) and the community records cited in my source documents. For the wider drainage context, read the northern Dhaka urbanization and pluvial-flooding study.

    Diabari Waterlogging and Solid Waste Management · Turag River Environmental Flow and Seasonal Change

    Back to Home · বাংলা সংস্করণ

  • দিয়াবাড়ির ওয়াটারলগিং ও সলিড ওয়েস্ট ম্যানেজমেন্ট

    Read in English · হোমপেজ

    ভারী বৃষ্টির পর এলাকার রাস্তায় পানি জমে থাকতে পারে, অথচ পানি সরবরাহের জন্য একই এলাকা গভীর গ্রাউন্ডওয়াটারের ওপর নির্ভর করে। দিয়াবাড়িতে এই আপাত বিরোধ বোঝা সহজ। বৃষ্টির পানি জমার জায়গা এবং বের হওয়ার সংযুক্ত পথ দরকার। সলিড ওয়েস্ট সেই পথের একাধিক স্থানে বাধা তৈরি করতে পারে।

    ওয়াটার ম্যানেজমেন্ট, সলিড ওয়েস্ট ও স্থানীয় ম্যাপিংয়ের কাজ মিলিয়ে আমি একটি ব্যবহারিক প্রশ্ন করেছি। ড্রেন পরিষ্কারের পর সেটি আবার বন্ধ হওয়া ঠেকাতে কী দরকার?

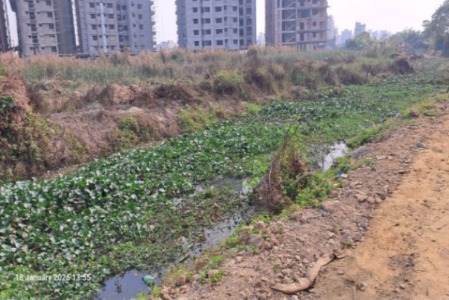
    দিয়াবাড়ির আবাসিক ভবনের পাশে বর্জ্য, স্থির পানি ও ঘন উদ্ভিদ। মূল ডকুমেন্ট থেকে নেওয়া ছবি, সেখানে দিয়াবাড়ি নেইবারহুড কমিউনিটি (২০২৬)-কে ক্রেডিট দেওয়া হয়েছে।
    দিয়াবাড়ির আবাসিক ভবনের পাশে বর্জ্য, স্থির পানি ও ঘন উদ্ভিদ। মূল ডকুমেন্ট থেকে নেওয়া ছবি, সেখানে দিয়াবাড়ি নেইবারহুড কমিউনিটি (২০২৬)-কে ক্রেডিট দেওয়া হয়েছে।

    পানি ও বর্জ্যের পথ একসঙ্গে অনুসরণ করুন

    রুফ ও রাস্তা থেকে রানঅফ ছোট ড্রেন, খাল, নিচু জমি এবং শেষে নদী বা পাম্পিং সিস্টেমে যায়। স্থানীয় ব্লকেজ চোখে পড়তে পারে। পাশাপাশি উঁচু রাস্তা, বিচ্ছিন্ন খাল, ডাউনস্ট্রিমের বেশি ওয়াটার লেভেল বা কম স্টোরেজও পানি আটকে রাখতে পারে। একটি ইনলেট পরিষ্কার করলে ভরাট হয়ে যাওয়া ওয়েটল্যান্ডের স্টোরেজ ফেরে না।

    বর্জ্যের পথও সংযুক্ত। বাসায় সেপারেশন, স্টোরেজ, সংগ্রহ, ট্রান্সফার, রিকভারি ও চূড়ান্ত ডিসপোজাল—প্রতিটি ধাপ গুরুত্বপূর্ণ। সংগ্রহ অনিয়মিত হলে বা ট্রান্সফার পয়েন্ট ভরে গেলে খাল বিকল্প ডাম্পিং পয়েন্ট হয়ে উঠতে পারে। তাই ড্রেন পরিষ্কার ও বর্জ্য সংগ্রহের অপারেটিং শিডিউল একসঙ্গে করতে হবে।

    দায়িত্ব স্পষ্ট করে এলাকার পরিকল্পনা করুন

    কাজকী পরিবর্তন হবেকী যাচাই করবেন
    নিচু জমি ও খালের সংযোগ রক্ষাবৃষ্টির স্টোরেজ ও রানঅফের পথ থাকবেকাজের আগে ইনলেট, আউটলেট, ক্রসিং ও মালিকানা ম্যাপ করুন
    নিয়মিত বর্জ্য সংগ্রহ ও সেপারেশনঅর্গানিকস ও প্লাস্টিক ড্রেনে যাওয়া কমবেসংগ্রহ বাদ পড়া ও পুনরাবৃত্ত ডাম্পিং পয়েন্ট রেকর্ড করুন
    ড্রেন পরিষ্কার এবং তোলা পদার্থ অপসারণব্লকেজ ডাউনস্ট্রিমে ঠেলে না দিয়ে ফ্লো ফেরানো যাবেতোলা বর্জ্য ও সিল্ট কোথায় যায় রেকর্ড রাখুন
    অর্গানিকস ও শুকনা রিসাইক্লেবল আলাদা করাকম্পোস্টিং ও মেটেরিয়াল রিকভারি সহজ হবেসেপারেশন, ওডর কন্ট্রোল ও পণ্য নেওয়ার ব্যবস্থা নিশ্চিত করুন
    উপযুক্ত কাজে রুফের বৃষ্টির পানি ব্যবহারকিছু রানঅফ ও সরবরাহের পানির চাহিদা কমবেডিমান্ড অনুযায়ী স্টোরেজ ও নিয়ন্ত্রিত ওভারফ্লো রাখুন

    একটি সমস্যাপ্রবণ রুট দিয়ে শুরু করুন

    বারবার পানি জমে এমন একটি রাস্তা বেছে নিরাপদ অবস্থায় ড্রেনেজ রুট অনুসরণ করুন। ইনলেট, কালভার্ট, খালের সংযোগ ও ডাম্পিং পয়েন্ট চিহ্নিত করুন। বাসিন্দাদের জিজ্ঞেস করুন কোথায় আগে পানি ওঠে, কতক্ষণ থাকে এবং নদীর পানি বাড়লে কী বদলায়। বৃষ্টির তারিখ ও প্রতিটি পর্যবেক্ষণের সময় লিখুন।

    এরপর সংগ্রহ, ব্লকেজ অপসারণ ও ডিসপোজালের জন্য দায়িত্বপ্রাপ্ত টিম নির্ধারণ করুন। পরিষ্কারের পরে এবং তুলনীয় বৃষ্টির পরে একই স্থান থেকে ছবি নিন। কত ট্রাক বর্জ্য উঠল, তার চেয়ে পানি কত দ্রুত নামল বেশি অর্থবহ। বৃষ্টি তুলনার সময় রেইনফল ও ডাউনস্ট্রিম ওয়াটার লেভেলও দেখতে হবে।

    সংগ্রহব্যবস্থার সঙ্গে মিলিয়ে রিকভারি ফ্যাসিলিটি করুন

    মেটেরিয়ালস রিকভারি ফ্যাসিলিটি বা MRF-এ পুনরুদ্ধারযোগ্য পদার্থ বাছাই করা হয়। শুকনা রিসাইক্লেবল আলাদা এলে এবং ক্রেতা থাকলে স্থানীয় ছোট ফ্যাসিলিটি কাজে আসতে পারে। অর্গানিকসের জন্য আলাদা নিয়ন্ত্রিত প্রসেস দরকার। অবশিষ্ট বর্জ্যের অনুমোদিত ডিসপোজাল রুটও থাকতে হবে। শুধু “রিসাইক্লিং” লেখা শেড দিয়ে মিশ্র বর্জ্য সংগ্রহের সমস্যা মেটে না।

    রেইনওয়াটার হারভেস্টিংয়ে প্রথমে পরিষ্কার-পরিচ্ছন্নতা বা অন্য উপযুক্ত নন-পটেবল ডিমান্ড বেছে নিন। ফার্স্ট ফ্লাশ, স্ক্রিনিং, ঢাকা স্টোরেজ, পরিষ্কারের অ্যাক্সেস ও ওভারফ্লো একসঙ্গে ডিজাইন করুন। গ্রাউন্ডওয়াটার রিচার্জের জন্য মাটি, পানির মান ও গ্রাউন্ডওয়াটারের অবস্থা আলাদাভাবে মূল্যায়ন করতে হবে।

    ম্যাপ থেকে কী জানা যায়

    মূল উপকরণে স্থানীয় ছবি, পুরোনো ইমেজারি এবং উত্তর ঢাকার প্রকাশিত গবেষণা আছে। এগুলো দিয়ে ডেভেলপমেন্ট ও ড্রেনেজ চাপ একই জায়গায় কোথায় হচ্ছে বোঝা যায়। শুধু ওয়াটার বা বিল্ট-আপ ইনডেক্স দিয়ে নির্দিষ্ট ব্লকেজের কারণ নির্ধারণ করা যায় না। সাইট লেভেল, আউটফল, রেইনফল ও মেইনটেন্যান্স রেকর্ড মিলিয়ে দেখতে হবে।

    আমার ব্যবহারিক অগ্রাধিকার

    বাকি পানির পথগুলো রক্ষা করে নিয়মিত বর্জ্য সংগ্রহকে ড্রেনেজ মেইনটেন্যান্সের সঙ্গে যুক্ত করব। বারবার ব্লকেজ কমা, পানি দ্রুত নামা ও নির্ভরযোগ্য ডিসপোজাল রেকর্ড দিয়ে ফল দেখব। ডেস্ক রিভিউভিত্তিক এই প্রস্তাব আগে ছোট রুটে পরীক্ষা করে পরে এলাকায় সম্প্রসারণ করা যায়।

    সহায়ক গবেষণা পড়ুন

    উত্তর ঢাকায় আরবানাইজেশন ও প্লুভিয়াল ফ্লাডিং নিয়ে সাকিব ও সহকর্মীদের ২০২৩ সালের গবেষণা ল্যান্ড ইউজ ও ড্রেনেজ একসঙ্গে দেখার কারণ ব্যাখ্যা করে। আমার মূল রিভিউতে মিউনিসিপ্যাল সলিড ওয়েস্ট বিষয়ে কবিরের ২০১৫ সালের কাজ এবং দিয়াবাড়ি নেইবারহুড কমিউনিটির ২০২৬ সালের রেকর্ডও ব্যবহৃত হয়েছে।

    দিয়াবাড়ির ওয়েটল্যান্ড, ড্রেনেজ ও হ্যাবিট্যাট সুরক্ষা · তুরাগ নদীর এনভায়রনমেন্টাল ফ্লো ও মৌসুমি পরিবর্তন

    হোমপেজে ফিরুন · English version

  • Diabari Waterlogging and Solid Waste Management

    বাংলায় পড়ুন · Home

    After a heavy shower, a neighborhood can have water on its roads while its water-supply system still depends on deep groundwater. Diabari makes that apparent contradiction easy to understand. Rainwater needs space to collect and a connected route to leave. Solid waste can interrupt that route at several points.

    I brought together my review of water management, solid waste, and local mapping to ask a practical question. What would keep the same drain from blocking again after it has been cleaned?

    Waste, stagnant water, and dense plant growth beside housing in Diabari
    Waste, stagnant water, and dense plant growth beside housing in Diabari. Photograph reproduced from the source documents, credited there to the Diabari Neighborhood Community (2026).

    Follow the water and the waste together

    Runoff moves from roofs and streets to small drains, canals, lowlands, and eventually a receiving river or pumping system. A local blockage may be visible, but water can also be held back by a raised road, a disconnected canal, a high downstream water level, or inadequate storage. Clearing one inlet cannot recover a filled wetland.

    Waste follows its own connected route. Household separation, storage, collection, transfer, recovery, and final disposal all matter. If collection is irregular or a transfer point is full, the canal may become the unofficial alternative. Drain cleaning and waste collection therefore need one operating schedule.

    A neighborhood plan with clear responsibilities

    ActionWhat it changesWhat to check
    Protect lowlands and canal connectionsRetains rainfall storage and a route for runoffMap the inlet, outlet, crossings, and ownership before work
    Collect and separate waste consistentlyKeeps organics and plastics out of drainsTrack missed collections and repeated dumping points
    Clear drains and remove the recovered materialRestores conveyance without moving the blockage downstreamRecord where the waste and silt actually go
    Separate organics and dry recyclablesMakes composting and material recovery more workableConfirm segregation, odor control, and a real outlet for products
    Capture roof rainwater for suitable usesReduces some runoff and demand for supplied waterMatch storage to demand and provide a managed overflow

    Start with one problem route

    Choose a frequently flooded street and trace its drainage route during safe conditions. Mark each inlet, culvert, canal connection, and repeated dumping point. Ask residents where water first appears, how long it remains, and whether the pattern changes when the river is high. Record the rain date and the time of each observation.

    Then assign a named team to collection, blockage removal, and disposal. Repeat the same photographs after cleaning and after a comparable rain. A shorter ponding duration is more informative than the number of truckloads removed. Comparing storms still needs rainfall and downstream-level context.

    Use recovery facilities where the collection system can support them

    A materials recovery facility (MRF) sorts recoverable materials. A small neighborhood facility can help when dry recyclables arrive separately and buyers can take them. Organics need their own controlled process. Residual waste still needs an approved disposal route. A shed labeled “recycling” cannot solve mixed-waste collection by itself.

    For rainwater harvesting, start with a useful demand such as cleaning or another suitable non-potable use. Design the first-flush arrangement, screening, covered storage, access for cleaning, and overflow together. Groundwater recharge needs a separate assessment of soil, water quality, and groundwater conditions.

    What the maps can tell us

    The source materials combine local photographs with historical imagery and published work on northern Dhaka. They help identify places where development and drainage pressure coincide. A water or built-up index alone cannot identify the cause of an individual blockage. Site levels, outfalls, rainfall, and maintenance records complete the picture.

    My practical priority

    Protect the remaining water pathways, then connect regular waste collection to drainage maintenance. I would judge success by fewer repeat blockages, shorter waterlogging, and a reliable disposal record. These are desk-review recommendations that can be tested on a small route before expanding across a neighborhood.

    Read the supporting evidence

    Sakib and colleagues’ 2023 study of urbanization and pluvial flooding in northern Dhaka explains why land use and drainage must be considered together. My source review also draws on Kabir (2015) on municipal solid waste and the Diabari Neighborhood Community’s 2026 records.

    Diabari Wetlands, Drainage and Habitat Protection · Turag River Environmental Flow and Seasonal Change

    Back to Home · বাংলা সংস্করণ