The roof producing the most electricity may have room to improve its output per installed panel capacity. That distinction is easy to miss in a monthly energy report. My comparison of four industrial rooftop installations in central Bangladesh begins with two questions. How much electricity arrived, and how much arrived per installed kilowatt-peak?
The records cover June 2024–May 2026. For the complete June 2025–May 2026 year, the four installations total 2,753.245 kWp and deliver 2,641.250 MWh. Locations are used to distinguish the systems.
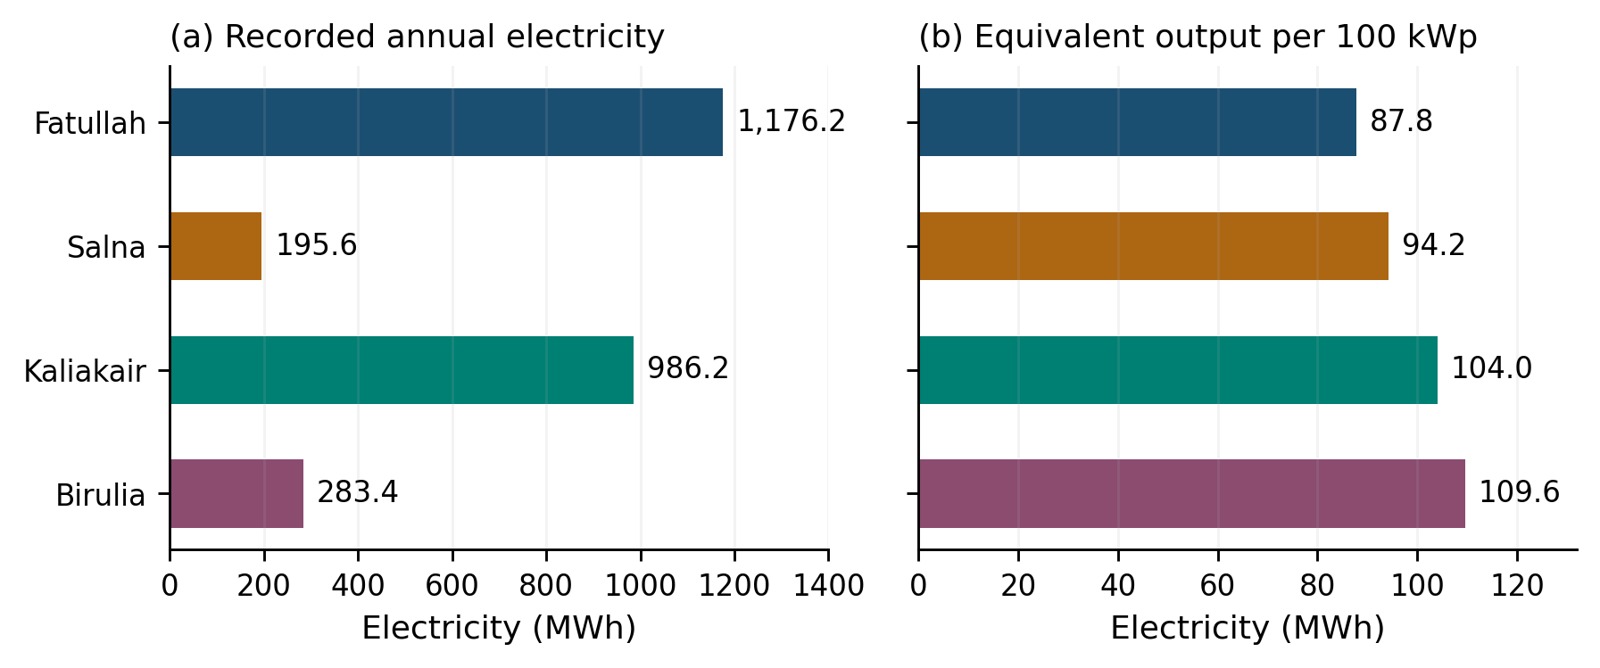
Compare equal reporting boundaries
| Location | DC capacity (kWp) | Annual generation (MWh) | Specific yield (kWh/kWp) |
|---|---|---|---|
| Fatullah | 1,339.215 | 1,176.161 | 878.25 |
| Salna | 207.570 | 195.553 | 942.11 |
| Kaliakair | 947.940 | 986.161 | 1,040.32 |
| Birulia | 258.520 | 283.375 | 1,096.14 |
Fatullah delivers the most electricity, while Birulia has the highest specific yield. Before making this comparison, check that capacity is stated on the same DC basis and that the energy meters cover the intended installation. Shared installations must be counted once.
Try the calculation
Specific yield = recorded energy (kWh) ÷ installed DC capacity (kWp). For Birulia, 283,375.2 ÷ 258.520 = 1,096.14 kWh/kWp for the year. At the same 100 kWp scale, this is about 109.61 MWh. Fatullah’s recorded yield corresponds to about 87.82 MWh per 100 kWp.
The difference between the highest and lowest specific yields is 24.81%. It is a reason to investigate roof geometry, shading, metering, inverter records, interruptions, and maintenance history. The energy figures alone do not identify which factor caused the difference.
Keep season length visible
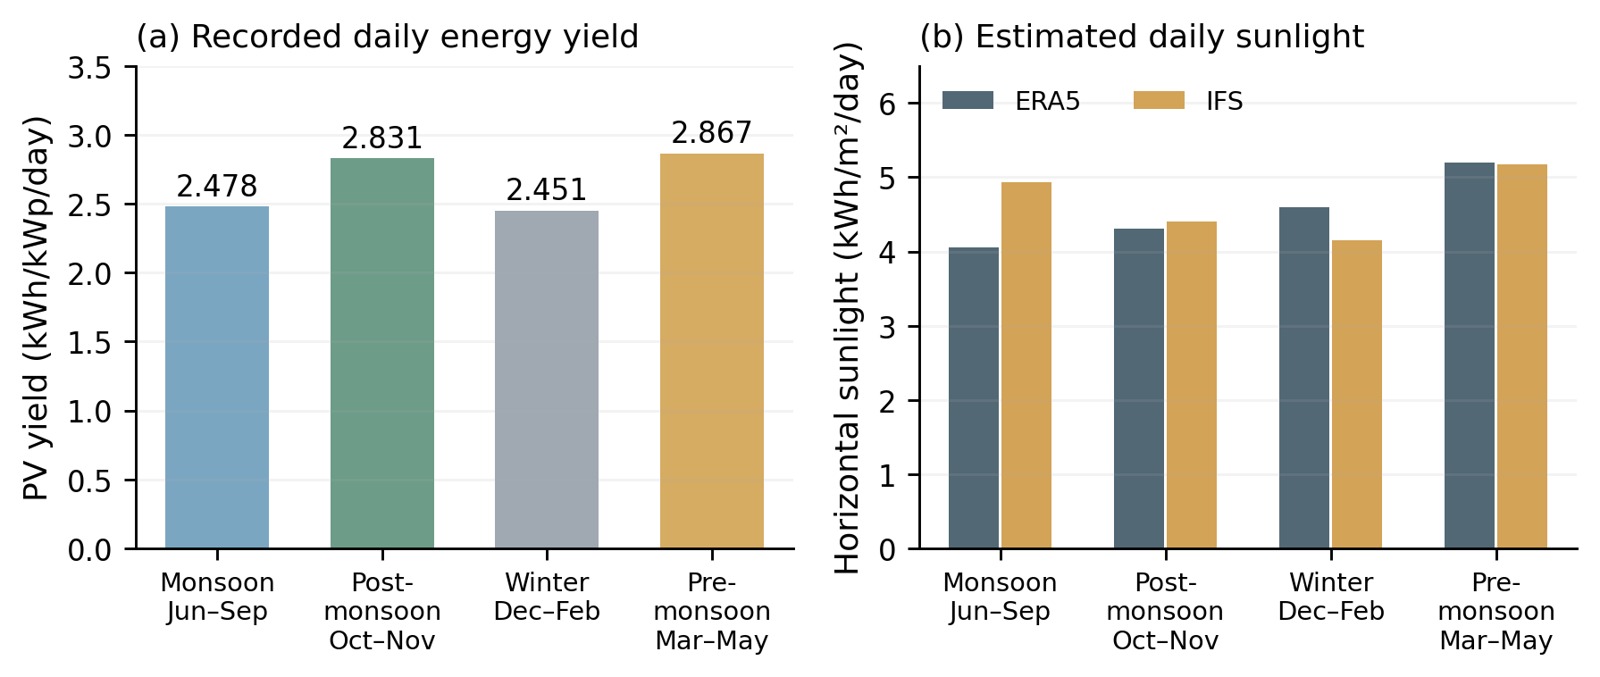
Pre-monsoon has the highest daily specific yield in this record, 2.867 kWh/kWp/day. Monsoon contributes the largest share of annual electricity, 31.51%, because its 122 days give it more time to accumulate energy. A budget needs both daily productivity and the number of days in the season.
Ask how much sunlight changed
The study pairs monthly energy with ERA5 and ECMWF IFS weather through Open-Meteo. The modeled annual horizontal-irradiation spread between locations is only 1.73% in ERA5 and 2.30% in IFS. Scaling the yields to a common horizontal sunlight basis keeps the same ranking.
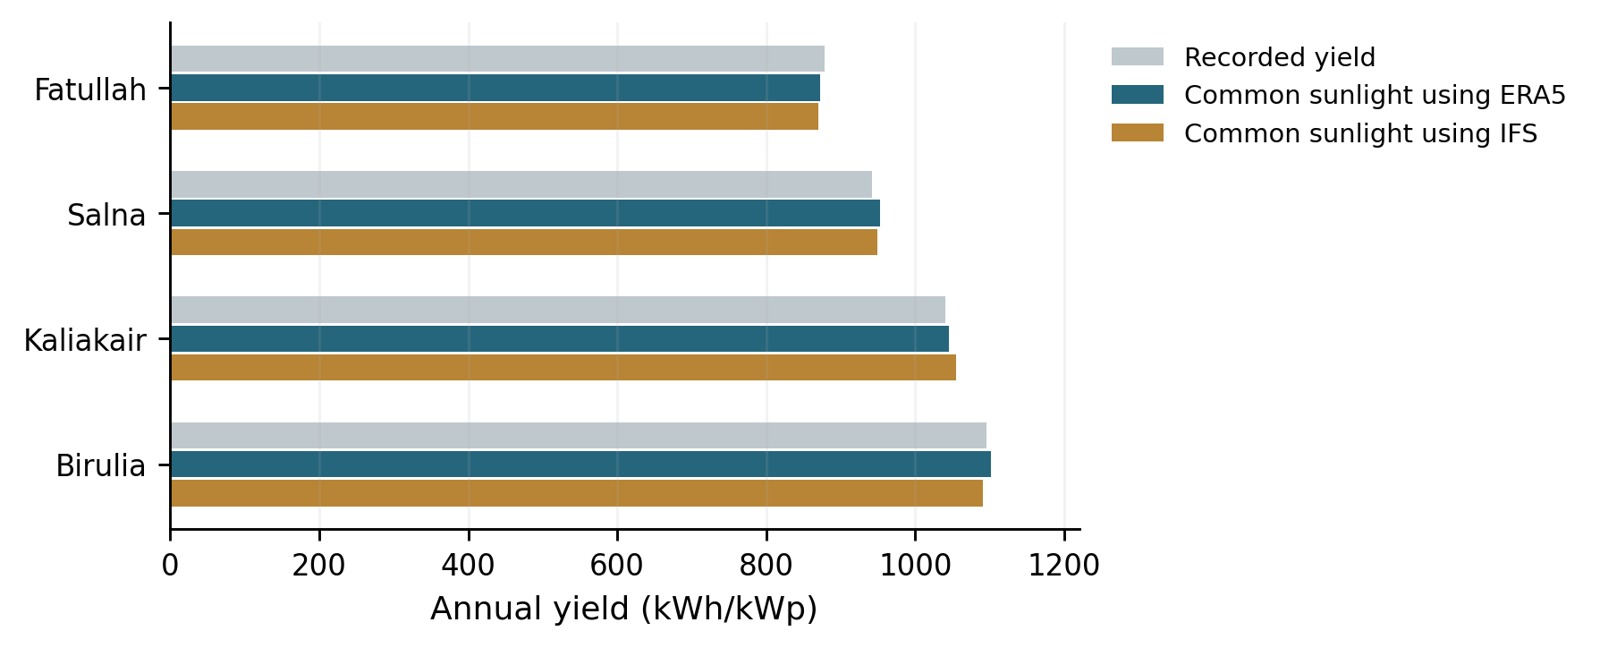
This makes regional sunlight an incomplete explanation for the observed gap. The comparison uses gridded horizontal weather data. A standard performance-ratio assessment needs an appropriate plane-of-array irradiation basis and a defined monitoring boundary.
Make the monthly O&M review useful
- Close each month with opening and closing meter readings, installed capacity, and missing-data notes.
- Calculate kWh/kWp and kWh/kWp/day before comparing installations or months.
- Compare matching calendar months and review the corresponding sunlight.
- For a persistent unexplained change, inspect inverter events, shading, soiling, outages, and the meter boundary.
- Record the action, date, and operating conditions, then compare the next suitable period.
The dataset has 95 usable installation-months. One Kaliakair month is unavailable in the earlier year, so matched comparisons use eleven month pairs there. Roof-plane irradiation and module temperature were outside the measurement record. These details define how far the results can be used.
My practical view
Start with dependable metering and a fair comparison. A weather-adjusted difference is a prompt for investigation. Choosing the right maintenance action requires equipment and operating evidence. The same discipline helps when reviewing an energy-saving proposal or a contractor’s performance claim.
References
Open-Meteo Historical Weather API provides the weather-product definitions. NREL’s weather-corrected performance-ratio report explains a more complete monitoring basis. The comparison uses recorded generation and capacity data for the four locations; the figures above are extracted from my analysis.
Continue reading
Rooftop Solar for Apartment Common Services · Diabari Waterlogging and Solid Waste Management · Practice Excel with plant data
Leave a Reply