A weekly O&M review should connect the reading, the decision, and the follow-up. I reviewed the five Excel starter files with that in mind. The new workbook brings their sample records together and shows where the team still needs evidence.
Download the dashboard workbook
Download the ETP/WTP O&M dashboard workbook (.xlsx). Start on Review Setup. Set the week for performance and cost, and the as-of date for due samples and actions. Edit the amber cells in the logs. The example readings and added plan, risk and cost records are fictional.
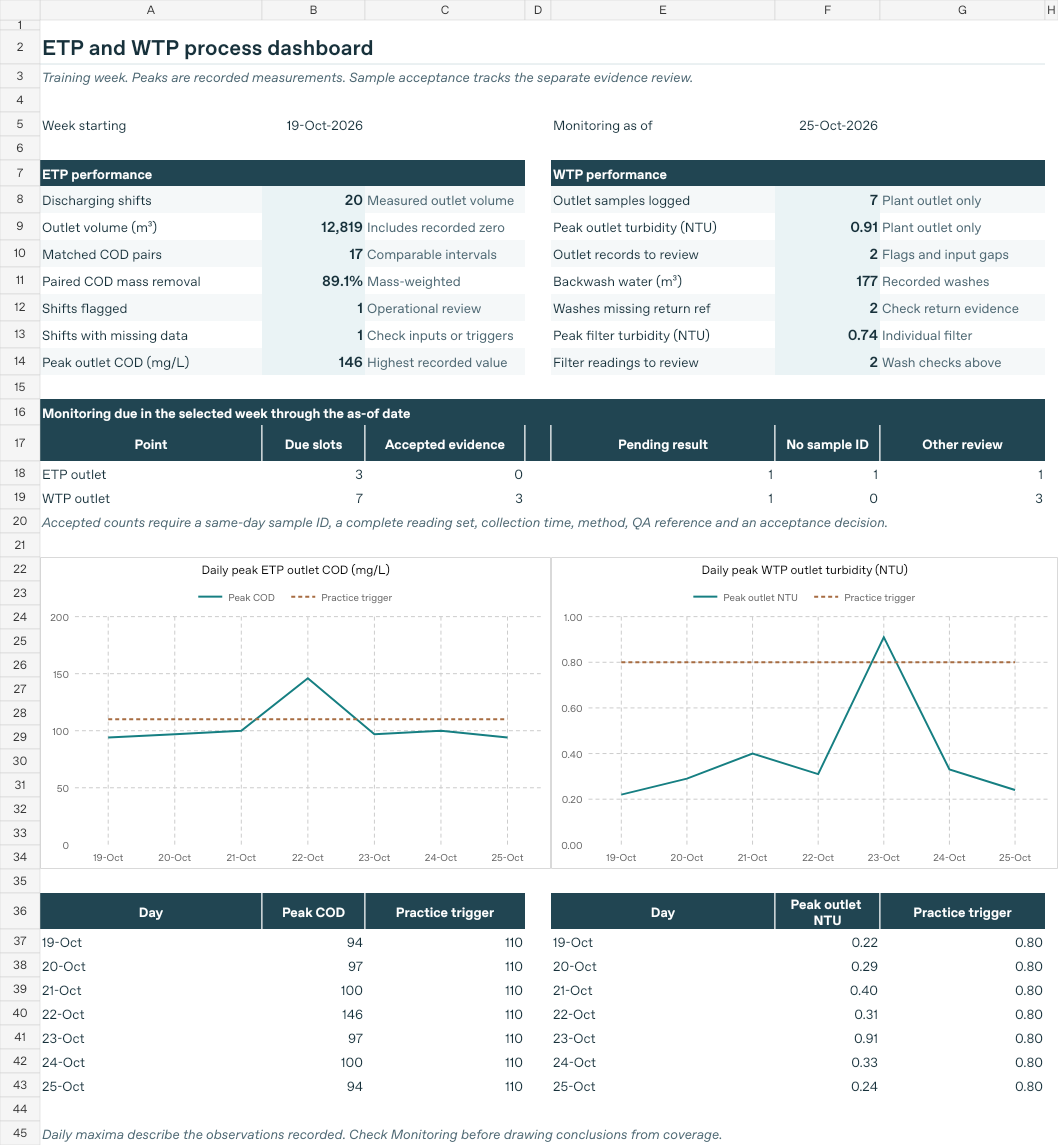
What the three dashboards show
- Process performance. The sample shows 89.1% COD mass removal from 17 comparable inlet/outlet pairs across 20 discharging shifts. Check the coverage alongside the result. The WTP logged 177 m³ of wash water and two washes still need a return-to-service reference.
- Asset reliability and actions. The sample ranks PM work by likelihood and consequence and shows two high-risk assets with overdue PM. An action moves to verified closed when the work date, verification date, reviewer and reference support that status.
- Resource cost and dosing. The training week shows 0.69 kWh/m³ and BDT 14.74/m³ for recorded energy and chemical costs. Each ratio uses its own matched intervals. One interval lacks a chemical quantity and drops out of the cost calculation. The pump example compares 30.00 L/h calculated with 29.40 L/h measured.
Where the five starter files fall short
| Workbook | Already covered | Evidence gap | Added in the dashboard workbook |
|---|---|---|---|
| ETP Shift and Performance Log | Shift volumes, COD pairing, review flags | Approved sampling schedule, method, collection and QA evidence | Planned events matched to sample IDs and logged results |
| WTP Filter and Water Quality Log | Separate filter readings, washes and outlet samples | Evidence of return-to-service checks and scheduled sample review | Backwash return references and due versus accepted samples |
| Plant PM and Work Orders | Asset IDs, PM intervals, owners and verification references | Condition, backup, risk rationale, renewal review and dated verification | Likelihood × consequence ranking, PM exposure and verified closure |
| Chemical Dosing and Operating Cost | One shift and a timed pump check | Comparable periods, energy baseline and pump test traceability | Matched weekly cost and energy rates plus test evidence fields |
| ETP/WTP O&M Checklists | Check result, evidence, owner and follow-up time | A shared register to follow issues across shifts and verify closure | Action IDs, source references, due dates and dated sign-off |
Try the monitoring view first. In the sample, 3 of 10 due slots have complete acceptance evidence, 2 have a result pending and 1 lacks a sample ID. The remaining 4 need evidence review. A recorded peak can prompt an operating check while the sample’s evidence review is still open.
Standards and guides to keep handy
- Bangladesh regulatory basis. Use the applicable DoE rules and plant clearance conditions when setting discharge obligations and reporting requirements. The workbook uses practice triggers. Environment Conservation Rules, 2023.
- Asset management and performance. Use ISO 55001 for the management system, EPA’s guide for building the asset plan, and the EUM Primer for selecting performance measures. ISO 24511 and ISO 24512 provide utility-level service assessment guidance. ISO 55001:2024 · EPA asset management guide · EPA EUM Primer · ISO 24511:2024 · ISO 24512:2024.
- Sampling and water safety. Keep the wastewater sampling plan and sample handling procedure with the record. For drinking-water plants, WHO’s water safety plan has separate templates for operational and compliance monitoring. The EPA turbidity guide is a technical reference for filter-level monitoring and backwash review. ISO 5667-10 · ISO 5667-3 · WHO Water Safety Plan Manual · EPA turbidity guide.
- Energy performance. Define the boundary and choose a comparable energy baseline before using kWh/m³ to judge improvement. Flow, load and operating duty can change the comparison. ISO 50006:2023.
For a live plant, start with the approved monitoring plan and name the people who can accept evidence and verify closure. A full standards assessment also needs the complete applicable documents, site procedures and implementation records. Use the shift and review checklists to capture the field evidence.
Leave a Reply